Doppler Effect: notes and practice questions
- This topic introduces the Doppler effect for sound waves and electromagnetic waves.
- It describes the change in observed frequency or wavelength due to relative motion between source and observer.
- Wavefront diagrams can represent the effect when either the source or the observer is moving.
- For light waves, the relative change in frequency or wavelength is given by .
- Shifts in spectral lines provide information about the motion of bodies like stars and galaxies in space.
- The Doppler effect has practical applications in medical physics and radar.
How it is examined
HL Paper 2 uses the mechanical equations directly. May 2025 HL Paper 2 TZ1 question 5(a) gave a stationary loudspeaker and a moving detector: state the direction of motion (1), then calculate the speed (2). The mark scheme is instructive on how strictly the source/observer choice is policed: it awarded zero for using the moving-source equation, awarded 1 mark for an answer of −20 m s⁻¹ with no comment, and 2 marks if the candidate said "20 away from the speaker". It also allowed the SL light approximation as an alternative route because it happens to give the same number here. Never generate a question with both source and observer moving.
SL: the light approximation . HL adds both mechanical-wave equations. Choosing the sign in the is the student's job and is where the marks go. The May 2023 update changed the wording of these two equations from "velocity" to "speed", so and are magnitudes.
- the nature of the Doppler effect for sound waves and electromagnetic waves
- the representation of the Doppler effect in terms of wavefront diagrams when either the source or the observer is moving
- the relative change in frequency or wavelength observed for a light wave due to the Doppler effect, where the speed of light is much larger than the relative speed between source and observer, as given by
- that shifts in spectral lines provide information about the motion of bodies like stars and galaxies in space
the observed frequency for sound waves and mechanical waves due to the Doppler effect, as given by: moving source , where is the speed of the source moving observer , where is the speed of the observer
Guiding questions
- How can the Doppler effect be explained both qualitatively and quantitatively?
- What are some practical applications of the Doppler effect?
- Why are there differences when applying the Doppler effect to different types of waves?
Linking questions
- What are the similarities and difference between light and sound waves?
- How can the Doppler effect be utilized to measure the rotational speed of extended bodies?
- What happens if the speed of light is not much larger that the relative speed between the source and the observer?
- What gives rise to emission spectra and how can they be used to determine astronomical distances?
- How can the use of Doppler effect for light be used to calculate speed? (NOS)
Practice questions
5 questions · 1 easy · 3 medium · 1 hardQuestion 1
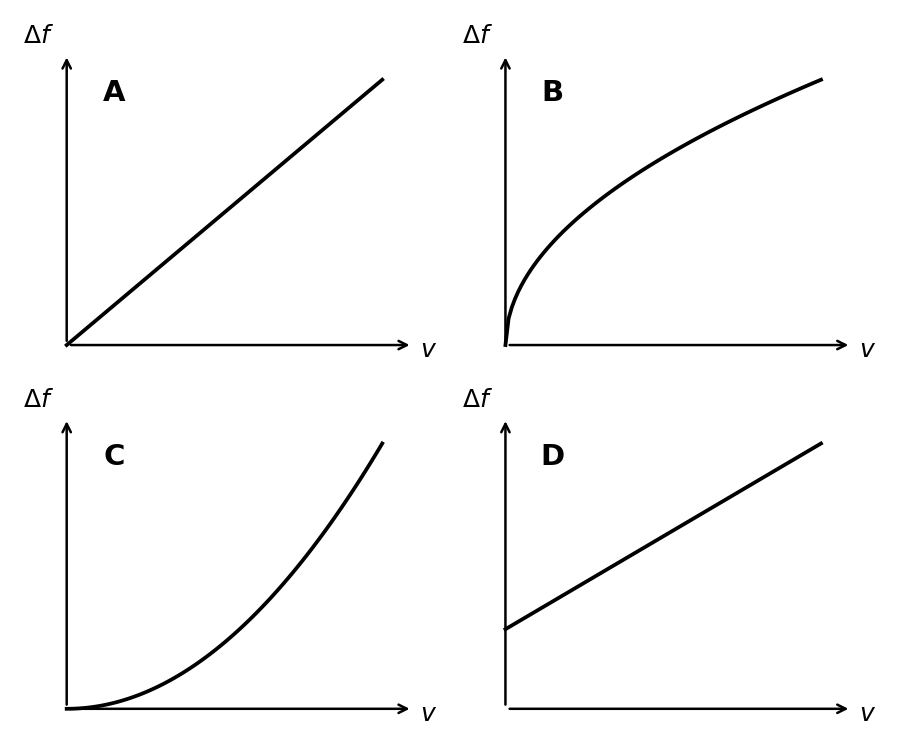
EasyPaper 1A · calculator1 markA star in a nearby galaxy is moving towards a stationary observer on Earth with a speed . The speed is much less than the speed of light . The star emits light of frequency . The frequency measured by the observer is .
Which graph shows the variation of the frequency shift with the speed ?
A. A
B. B
C. C
D. D
Recall the approximate formula for the Doppler shift of light for speeds much less than the speed of light. Analyze the relationship between the frequency shift and the relative speed of the source.
Question 2
MediumPaper 1A · calculator1 markA police car with its siren on is stationary at a traffic light. A stationary observer is located some distance behind the car. At time , the traffic light turns green and the car begins to accelerate uniformly, moving directly away from the observer, until time . The frequency of the siren is .
The speed of the car is always much less than the speed of sound.
What is the variation with of the relative change of frequency of the observed sound?
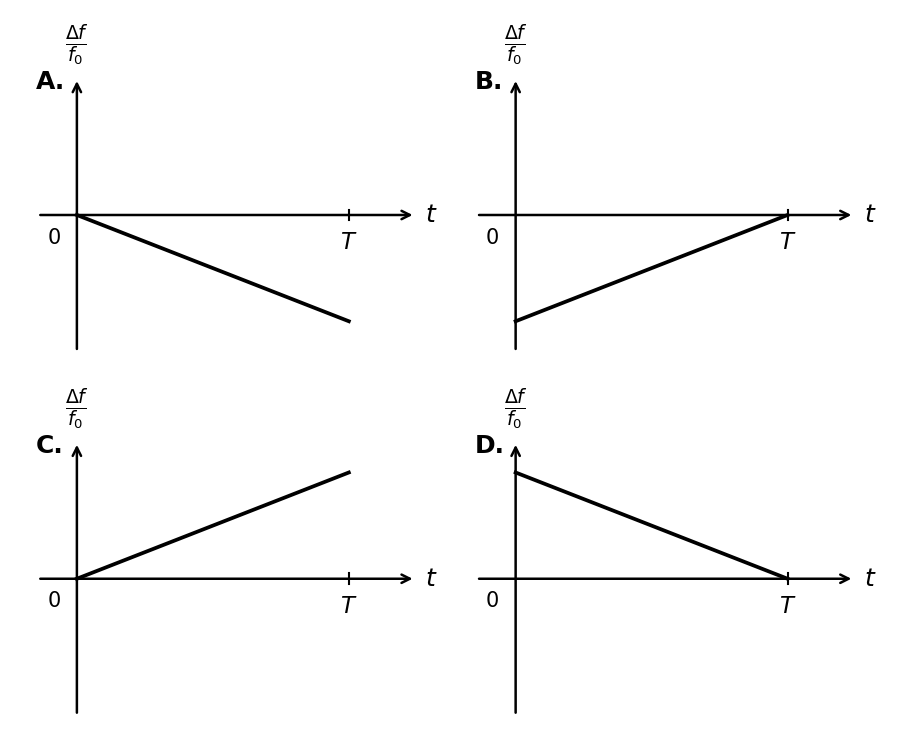
Consider the Doppler effect formula for a source moving away from an observer. How does the speed of the source change with time, and how does this affect the observed frequency shift? Remember that a frequency decrease corresponds to a negative change in frequency.
Question 3
HardPaper 2 · calculator18 marksAn electric ski lift is powered by a motor at the base station. The motor is connected to a 750 V DC power supply by a cable with a total resistance of 0.15 Ω. When operating at full capacity, the motor draws a constant current of 400 A.
(a) Determine the potential difference across the terminals of the motor.
(b) The motor has an efficiency of 92%. Calculate the useful mechanical power output of the motor.
The ski lift carries skiers up a slope of length 1800 m that rises by a vertical height of 500 m. There are 50 chairs on the ascending side. Each empty chair has a mass of 25 kg and carries, on average, 1.5 skiers of average mass 75 kg. A constant resistive force of 12 kN opposes the motion.
(c) Determine the total upward force the motor must provide via the cable to maintain a constant speed.
(d) Estimate the maximum speed, , of the ski lift.
(e) The lift operates continuously. Estimate the maximum number of skiers that can be transported to the top station in one hour.
(f) In an emergency stop, a brake is applied to a large solid steel disc, bringing the lift to a halt from its maximum speed. The total mass of the moving system (chairs, skiers, and cable) is 18 000 kg. Assume all the kinetic energy of the system is converted into thermal energy in the brake disc.
Calculate the temperature rise of the disc.
Data for this question:
Brake disc radius = 0.75 m
Brake disc thickness = 0.10 m
Density of steel = 7850 kg m⁻³
Specific heat capacity of steel = 450 J kg⁻¹ K⁻¹
(g) The speed of a chair is monitored using a radar device at the base station that emits microwaves of frequency 30 GHz. It measures the waves reflected from a chair as it moves away. The frequency shift, , for a source moving directly away from a stationary observer can be approximated by the formula . In this radar measurement, this formula gives a good approximation for the shift detected.
Calculate the expected frequency shift.
First, calculate the voltage that is 'lost' in the power cable due to its resistance. Then, consider how this affects the voltage available for the motor from the main power supply.
First, find the electrical power being supplied to the motor using your answer from part (a). Then, use the efficiency to find how much of this is converted into useful mechanical power.
The total upward force must balance all the downward forces. This includes the component of the total weight acting parallel to the slope and the resistive force. First, find the angle of the slope or the sine of the angle.
At a constant speed, the mechanical power output of the motor is used to overcome the total force at that speed. Use the relationship between power, force, and velocity.
You can calculate the number of skiers arriving per second, then convert to per hour. Alternatively, find how long it takes for one chair to travel the full length, which tells you the rate at which chairs arrive at the top.
This is a conservation of energy problem. The initial kinetic energy of the entire moving system is converted into thermal energy (heat) in the brake disc. You'll need to calculate the kinetic energy first, then the mass of the disc, and finally use the specific heat capacity formula.
You are given the formula for the Doppler shift. Rearrange it to find the change in frequency, Δf. Make sure all your values are in SI units before you calculate.
Question 4
MediumPaper 1A · calculator1 markA star is moving with speed towards a stationary observer on Earth. The star emits light of frequency . The frequency measured by the observer is . The speed is much less than the speed of light .
Which graph shows the variation of the observed frequency with the speed ?
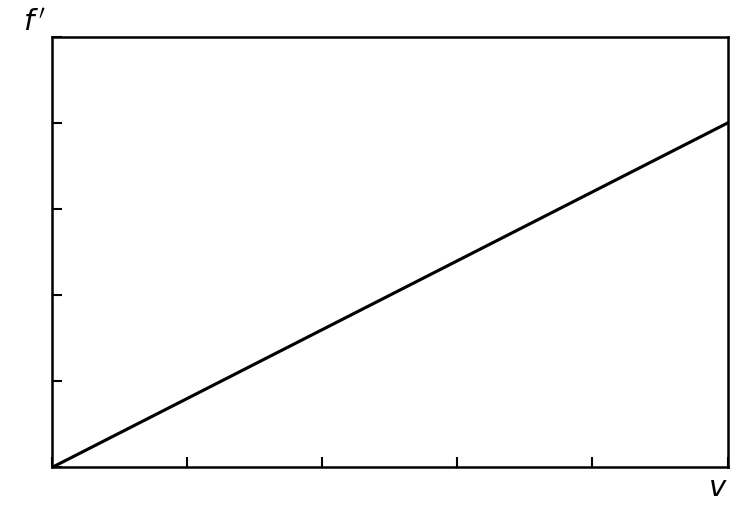
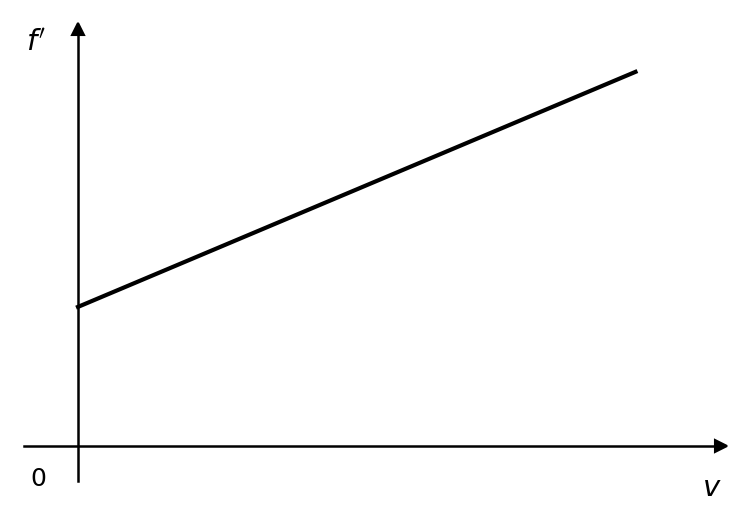
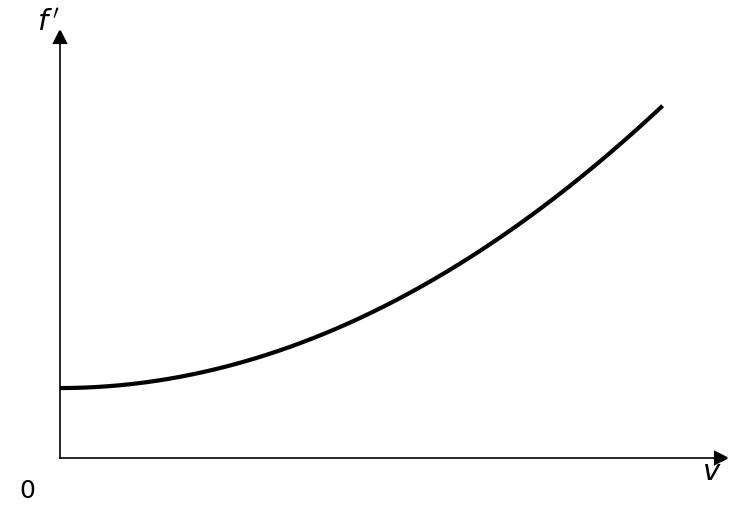
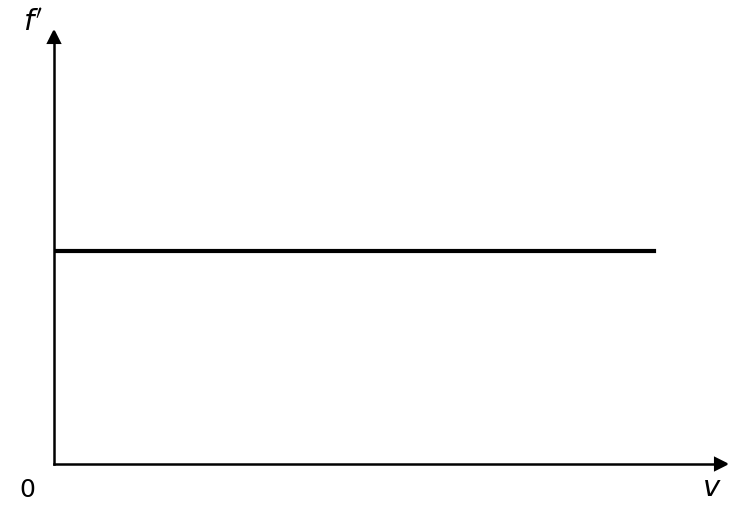
Recall the formula for the Doppler shift for light when the source speed is much less than the speed of light. How does the observed frequency relate to the emitted frequency and the speed of the source? Consider what the observed frequency would be if the star were stationary ().
Question 5
MediumPaper 1A · calculator1 markAn astronomer analyses the spectrum of light received from a distant star. Three assertions are made about this spectrum.
I. The dark lines in the star's absorption spectrum correspond to the emission lines of elements in the star's outer atmosphere.
II. The redshift of these spectral lines can be used to determine the star's surface temperature.
III. The existence of discrete spectral lines provides evidence for the quantization of electron energy levels in atoms.
Which of the assertions are correct?
A. I and II only
B. I and III only
C. II and III only
D. I, II and III
Consider the physical origin of absorption and emission spectra. What information can be derived from the specific wavelengths of spectral lines, and what information can be derived from shifts in these wavelengths? How do spectral lines relate to atomic structure?
No question on this page matches those filters. Try another difficulty or paper.
Every Doppler Effect question, marked for you
Every answer is marked mark by mark, IB-style, and the AI tutor helps when you are stuck.
Where marks are lost
- Stopping one step short of the conclusion. Two numbers and no sentence is two marks out of three.
- Answering a procedure question with a platitude.
- Losing precision in Paper 1B. Uniquely to this paper, quoting the right number badly loses marks.
