Collecting and processing data: notes and practice questions
- This topic covers the essential skills for gathering, organizing, and making sense of experimental observations and measurements in chemistry.
- Identify and record relevant qualitative observations and sufficient quantitative data.
- Address issues that arise during data collection.
- Carry out relevant and accurate data processing.
- Interpret qualitative and quantitative data, including diagrams, graphs, and charts.
- Identify, describe, and explain patterns, trends, and relationships.
- Assess accuracy, precision, reliability, and validity of data.
- Justify the removal or inclusion of outliers in data (no mathematical processing).
How it is examined
The core of Paper 1B. Data tables in the stem, then processing and interpretation. May 2025 HL Paper 1B TZ1 gave a mixture of iron, sand and salt with masses and asked for percentage composition (1 mark for both values together), then asked why the iron percentage was misleading (1 mark, answer about density). Expect graph reading, gradient, and "identify the anomalous result" parts at 1 to 2 marks each.
- Identify and record relevant qualitative observations.
- Collect and record sufficient relevant quantitative data.
- Identify and address issues that arise during data collection.
- Carry out relevant and accurate data processing.
No additional higher level content in Inquiry 2.
Guiding questions
- None given.
Linking questions
- Structure 1.3 In the study of emission spectra from gaseous elements and of light, what qualitative and quantitative data can be collected from instruments such as gas discharge tubes and prisms?
- Structure 1.4 How can a calibration curve be used to determine the concentration of a solution?
- Structure 3.1 What experimental data demonstrate the physical properties of metals, and trends in these properties, in the periodic table?
- Reactivity 3.2 What observations can be made when metals are mixed with aqueous metal ions, and solutions of halogens are mixed with aqueous halide ions?
Practice questions
13 questions · 3 easy · 7 medium · 3 hardQuestion 1
EasyPaper 1A · calculator1 markFour students each perform three trials to determine the concentration of an aqueous sodium hydroxide solution. The accepted literature value is .
Which set of results is precise but not accurate?
A. , ,
B. , ,
C. , ,
D. , ,
Recall that precision refers to how close repeated measurements are to one another, whereas accuracy describes how close the values are to the true or accepted reference value.
Question 2
MediumPaper 1A · calculator1 markA student carries out five trials of an acid–base titration using phenolphthalein indicator. The recorded titres are shown in the table.
| Trial | Titre / cm³ |
|---|---|
| 1 | 21.45 |
| 2 | 21.40 |
| 3 | 22.90 |
| 4 | 21.50 |
| 5 | 21.40 |
During Trial 3, the student observed that the reaction mixture turned an intense, dark magenta colour rather than the faint, permanent pink observed in the other trials.
Which statement deduces the correct decision and provides the valid justification for calculating the mean titre?
A. Include Trial 3, because averaging all collected trials minimizes random error.
B. Include Trial 3, because removing recorded data points introduces investigator bias.
C. Exclude Trial 3, because a documented procedural error produced an outlier that would systematically skew the mean.
D. Exclude Trial 3, because any trial that is not concordant with Trial 1 is automatically discarded as random error.
Consider the qualitative observation recorded during Trial 3. Does an intense magenta colour indicate that the equivalence point was accurately reached, or that a procedural mistake occurred?
Question 3
HardPaper 1B · calculator3 marksTwo students independently investigated the effect of hydrochloric acid concentration on the rate of reaction with excess calcium carbonate:
Student A measured the time taken to produce of carbon dioxide gas at four different acid concentrations. Student A performed a single trial at each concentration.
(a) Comment on the reliability of Student A's data.
(b) Student B performed three trials at each acid concentration, obtaining closely agreeing times for each. However, the temperature of the acid was not kept constant, rising from for the lowest concentration to for the highest concentration.
Comment on the validity of Student B's conclusion that the observed increase in rate was due solely to the increase in acid concentration.
Recall that reliability refers to the consistency and repeatability of results. Consider whether an experiment with no repeated trials allows you to detect anomalies or verify reproducibility.
Validity concerns whether an investigation is truly measuring what it claims to measure. Think about what happens when a variable that affects reaction rate is left uncontrolled.
Question 4
EasyPaper 1A · calculator1 markA student determines the enthalpy change of neutralization, , for the reaction between aqueous sodium hydroxide and hydrochloric acid. The accepted literature value is .
The experimental values obtained over four trials are recorded in the table below:
| Trial | |
|---|---|
| 1 | |
| 2 | |
| 3 | |
| 4 |
Determine which row correctly describes the accuracy, precision, and main type of experimental error present in this data set.
| Accuracy | Precision | Main type of experimental error | |
|---|---|---|---|
| A. | High | High | Random error |
| B. | High | Low | Systematic error |
| C. | Low | High | Systematic error |
| D. | Low | Low | Random error |
Recall the definitions of accuracy and precision: accuracy relates to how close the experimental results are to the true literature value, whereas precision relates to how close repeated measurements are to each other. Consider whether a consistent, one-sided shift from the true value is caused by random or systematic error.
Question 5
MediumPaper 1A · calculator1 markA student investigates the rate of reaction between magnesium ribbon and excess dilute hydrochloric acid by measuring the time taken for the magnesium to react completely. Five trials were performed under identical conditions.
| Trial | Time / s |
|---|---|
| 1 | 48 |
| 2 | 47 |
| 3 | 32 |
| 4 | 49 |
| 5 | 48 |
During Trial 3, the student recorded a qualitative observation that the stopwatch was started several seconds after the magnesium was added to the acid and bubbling had already begun.
Which statement gives the correct deduction and justification for processing the data to determine the mean reaction time?
A. Trial 3 should be excluded because an identified procedural error caused an anomalously low reaction time.
B. Trial 3 should be included because averaging all trials reduces the effect of random errors.
C. Trial 3 should be excluded because the value differs by more than 10 s from the first trial.
D. Trial 3 should be included because removing any collected data point introduces investigator bias.
Consider whether the anomalous value in Trial 3 was caused by normal random fluctuations or by a known procedural mistake during data collection.
Question 6
HardPaper 1B · calculator2 marksTwo students independently investigate the effect of temperature on the rate of reaction between zinc and excess dilute hydrochloric acid:
Each student measures the volume of hydrogen gas collected in a gas syringe over the first of the reaction at four temperatures: , , , and .
• Student A uses zinc granules and performs a single trial at each temperature.
• Student B performs three trials at each temperature. However, after completing the trials at and , Student B runs out of zinc granules and uses the same mass of powdered zinc for the trials at and .
(a) Comment on the reliability of the data obtained by Student A compared to Student B.
(b) Comment on the validity of Student B's conclusion regarding the effect of temperature on the reaction rate.
Recall that reliability relates to the consistency of results and the ability to detect anomalous data through repetition.
Validity concerns whether the experiment actually tests what it is intended to test. Check whether all variables other than temperature were properly controlled across the trials.
Question 7
EasyPaper 2 · calculator2 marksA student investigates the absorbance of aqueous copper(II) sulfate solutions of different concentrations using a colorimeter at a wavelength of 635 nm. The quantitative measurements and qualitative observations are recorded in the table below.
| Concentration of / | Absorbance | Appearance of solution |
|---|---|---|
| 0.020 | 0.15 | Very pale blue |
| 0.040 | 0.31 | Pale blue |
| 0.060 | 0.46 | Mid-blue |
| 0.080 | 0.62 | Deep blue |
| 0.100 | 0.77 | Intense dark blue |
(a) Describe the relationship between the concentration of and absorbance shown by the data.
(b) Describe the qualitative trend in the appearance of the solution as the concentration increases.
Look at what happens to the absorbance values as the concentration of copper(II) sulfate increases by equal increments.
Focus on how the color description in the third column of the table changes from the lowest concentration to the highest concentration.
Question 8
MediumPaper 1B · calculator3 marksA student carried out an experiment to determine the enthalpy change of combustion of ethanol, , using a spirit burner to heat a beaker containing water. The temperature of the water was measured using a thermometer with an uncertainty of for each reading.
The recorded temperature data are shown below:
| Measurement | Value |
|---|---|
| Initial temperature of water | |
| Final temperature of water |
(a) Calculate the percentage uncertainty in the temperature increase, .
(b) The student calculated their experimental enthalpy change of combustion of ethanol to be . The literature value for the standard enthalpy change of combustion of ethanol is .
Calculate the percentage error in the student's experimental result.
First find the temperature rise and remember how absolute uncertainties combine when two readings are subtracted. Then calculate the uncertainty as a fraction of that temperature rise multiplied by 100.
Recall the percentage error formula: compare the difference between the experimental and literature values to the accepted literature value.
Question 9
HardPaper 1B · calculator16 marksNitrogen dioxide, a pollutant from car exhausts, reacts with water in the atmosphere to form nitric acid and nitrous acid. This is a disproportionation reaction.
(a) Deduce the oxidation states of nitrogen in the reactant and products.
Reactant:
Products: ,
(b) Explain, with reference to the equilibrium, why more nitrogen dioxide gas dissolves when the reaction occurs in alkaline rainwater.
(c) The solubility of nitrogen dioxide gas in water was measured by different scientific groups. A summary of their results is shown.
| Source | Temperature / °C | Solubility of gas in 0.100 dm³ of water |
|---|---|---|
| A | 0 | 0.380 dm³ |
| B | 10 | 0.28 dm³ |
| C | 20 | 200 cm³ |
| D | 25 | 0.15 L |
| E | 30 | 0.120 dm³ |
(i) Identify a problem in comparing the data from the different sources as presented in the table.
(ii) The units of solubility are converted to mol dm⁻³. Complete the table by calculating the value for source A. Assume the atmospheric pressure is 100 kPa and the density of the resulting solution is 1.00 g cm⁻³.
(iii) Suggest an explanation for the effect of temperature on the solubility of nitrogen dioxide gas.
(d) Suggest one reason why nitrogen dioxide is considered a major air pollutant.
(e) Nitrous acid, , is a weak acid. The graph shows the percentage of nitrous acid and its conjugate base, the nitrite ion (), present at different pH values.
(GRAPH IS A STANDARD SPECIATION PLOT FOR A WEAK ACID. X-AXIS: pH from 0 to 8. Y-AXIS: Percentage from 0 to 100. A curve for HA starts at 100% and goes down, a curve for A- starts at 0% and goes up. The two curves cross at pH = 3.3, where each is at 50%.)
(i) Deduce the pH range where nitrous acid, , is the dominant nitrogen-containing species in the solution.
(ii) Determine, with reference to the graph, the of nitrous acid.
(f) Nitrous acid can react with secondary amines to form N-nitrosamines, which are potent carcinogens. An example is the reaction with dimethylamine, .
(i) Deduce a balanced chemical equation for the formation of N-nitrosodimethylamine, , from dimethylamine and nitrous acid.
(ii) The rate of N-nitrosamine formation is highly dependent on pH. The reaction rate is highest under mildly acidic conditions where there is a sufficient concentration of both the unprotonated amine and nitrous acid. State two conditions that could be maintained in an industrial process to minimize the formation of N-nitrosamines.
(g) To combat the effects of acid rain, powdered limestone () is sometimes added to lakes. Suggest two distinct reasons why this 'liming' process is effective at restoring the aquatic ecosystem.
Remember the rules for assigning oxidation states. Oxygen is usually -2 and hydrogen is usually +1. The sum of oxidation states in a neutral molecule is zero.
Alkaline conditions imply the presence of a base, like hydroxide ions (). How would a base react with the acidic products of the forward reaction? Consider Le Châtelier's principle.
Look closely at the units used for solubility in the table. Are they all consistent? What other variable that affects gas solubility might be missing?
To find the concentration in mol dm⁻³, you first need to find the moles of gas. You are given the volume of the gas, the temperature, and the pressure. The ideal gas law might be useful here.
Observe the trend in the table: as temperature increases, what happens to the volume of gas that dissolves? The dissolution of a gas in a liquid is an equilibrium process. How does temperature affect exothermic and endothermic equilibria?
Consider the direct effect of on human health or its role in forming other harmful substances in the environment.
The 'dominant' species is the one present in a higher concentration (or percentage). Find the part of the graph where the curve for is above the curve for .
The has a special significance on a speciation graph. It is the pH at which the concentrations of the weak acid and its conjugate base are equal.
The reactants are and . The products are and one other small molecule. Identify the atoms that are not part of the nitrosamine product to deduce the other product.
To minimize the formation of a product, you can either remove one of the reactants or change the conditions (like pH) to make the reaction much slower. Consider what pH would minimize the concentration of one of the key reactants, .
Think about the direct chemical effect of adding a base () to an acidified lake. Then, consider how this action might affect the equilibrium involving the atmospheric pollutant that caused the acid rain in the first place.
Question 10
MediumPaper 1B · calculator5 marks(a) A student investigated the catalytic decomposition of aqueous hydrogen peroxide:
The concentration of remaining in the reaction mixture was determined at intervals. The data obtained are shown in the table.
| Time / s | |
|---|---|
| 0 | 1.000 |
| 60 | 0.760 |
| 120 | 0.580 |
| 180 | 0.440 |
| 240 | 0.335 |
Calculate the average rate of consumption of between and , stating its unit.
(b) The initial concentration of was recorded as with an absolute uncertainty of .
Calculate the percentage uncertainty in this initial concentration.
(c) The accepted literature value for this average rate of consumption under identical conditions is .
Calculate the percentage error of the experimental rate determined in part (a).
Consider the change in concentration of divided by the elapsed time interval. Combine the units of concentration and time to write the unit of rate.
Divide the absolute uncertainty by the measured concentration value and multiply by 100.
Use the percentage error formula: , using your calculated rate from part (a).
Question 11
MediumPaper 2 · calculator3 marks(a) A student carried out an experiment to determine the enthalpy change of neutralization between of and of . The solutions were mixed in an open glass beaker. The initial temperature of each solution was and the maximum temperature reached was . The calculated enthalpy change was , which is significantly less exothermic than the literature value of .
Suggest one reason why the maximum temperature recorded during data collection was lower than the expected theoretical value.
(b) Suggest two modifications to the experimental apparatus or procedure that would address the issue identified in part (a) and improve the accuracy of the determined enthalpy change.
Consider where thermal energy could be transferred rather than remaining in the solution when a reaction is performed in an uninsulated glass beaker open to the air.
Think about how to prevent heat escaping through the walls or open top of the container, or how temperature can be monitored at timed intervals to account for heat lost during the reaction.
Question 12
MediumPaper 1B · calculator8 marksAn experiment was conducted to investigate the effect of temperature on the rate of reaction between excess calcium carbonate chips and 100 cm³ of 0.5 mol dm⁻³ hydrochloric acid. The volume of carbon dioxide gas produced was collected in a gas syringe. The results for the reaction at 25 °C (Experiment 1), 35 °C (Experiment 2), and 45 °C (Experiment 3) are plotted on the graph below.
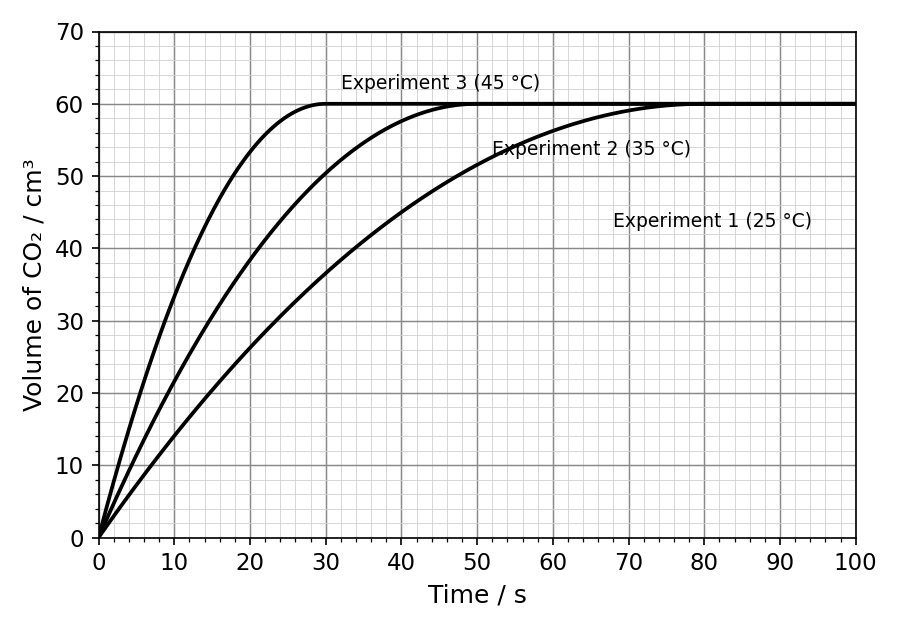
(a) By annotating the graph, determine the initial rate of reaction for Experiment 2, in cm³ s⁻¹.
(b) Estimate the time required for Experiment 1 to produce half of the total volume of CO₂.
(c) Suggest two reasons, in terms of collision theory, why the rate of reaction in Experiment 3 (45 °C) is greater than in Experiment 1 (25 °C).
(d) Calculate the percentage increase in the volume of CO₂ produced after 20 seconds when the temperature is increased from 25 °C (Experiment 1) to 45 °C (Experiment 3).
(e) The experiment was performed in a sealed flask connected to the gas syringe. Sketch a graph of the total mass of the apparatus against time for Experiment 1 and provide a reason for its shape.
To find the initial rate of reaction from a curve, you need to find the gradient of the curve at the very beginning (at time t=0). How do you calculate the gradient of a curve at a specific point?
First, identify the final volume of gas produced from the graph. Then, find half of this value on the y-axis and read the corresponding time from the curve for Experiment 1.
Think about how increasing temperature affects the movement of particles and the energy they possess. How does this relate to the requirements for a successful collision?
Read the volumes for Experiment 1 and Experiment 3 at t=20s from the graph. Then use the formula for percentage increase: ((New Value - Original Value) / Original Value) × 100%.
The apparatus consists of the flask, reactants, and the attached syringe. Consider whether any matter can enter or leave this entire system during the reaction. What law governs this?
Question 13
MediumPaper 1B · calculator9 marksA food chemist is analyzing the components of a new artificial sweetener mixture using paper chromatography. A small spot of the mixture is applied to a chromatography paper, and the paper is placed in a sealed chamber with a solvent system consisting of ethanol and water. After some time, the solvent front moves up the paper, separating the components.
(a) Define the stationary phase and the mobile phase in this paper chromatography experiment.
(b) Explain why it is important that the initial spot of the sweetener mixture is applied above the solvent level in the chamber, and why the solvent front should not be allowed to reach the very top of the chromatography paper.
(c) After the chromatography run, the solvent front travelled from the start line. Two distinct components, Sweetener A (yellow) and Sweetener B (blue), were observed to have travelled and respectively from the start line.
Calculate the retardation factor, , for Sweetener A and Sweetener B. Show your working.
(d) The stationary phase (paper) is polar due to cellulose, and the mobile phase is a moderately polar mixture of ethanol and water.
Deduce, with a reason, which sweetener (A or B) is more polar.
(e) If Sweetener A and another component had very similar values and were not well separated, suggest one modification to the experiment that could improve their separation.
Recall the definitions of stationary and mobile phases in chromatography. Consider what the paper is made of and what the solvent does.
Consider what would happen if the sample dissolved directly into the solvent pool. Think about the purpose of separating components along the paper and the accuracy of measurements.
The retardation factor () is calculated as the distance travelled by the component divided by the distance travelled by the solvent front.
Consider the principle of 'like dissolves like' and how it applies to the interaction of the sweeteners with the stationary and mobile phases. A higher value indicates a greater affinity for the mobile phase.
Think about factors that influence the differential partitioning of components between the stationary and mobile phases.
No question on this page matches those filters. Try another difficulty or paper.
Every Collecting and processing data question, marked for you
Every answer is marked mark by mark, IB-style, and the AI tutor helps when you are stuck.
Where marks are lost
- Reaching for "human error" or "only one trial." A source of error has to be a specific step in the method, not a general apology for the result.
- Joining the dots instead of drawing a curve.
- Naming a chemical instead of the property that distinguishes it, or vice versa. Answering with the nearest fact that comes to mind rather than the fact the command term and stem jointly ask for is a recurring way to answer a question that was not, quite, the one asked.
