How fast? the rate of chemical change: notes and practice questions
- This topic covers how the rate of a chemical reaction can be controlled.
- Reaction rate is the change in concentration of a reactant or product per unit time.
- Collision theory states that particles must collide with sufficient energy and correct orientation to react.
- Factors influencing reaction rate include temperature, concentration, pressure, surface area, and catalysts.
- Activation energy, , is the minimum energy required for a successful collision.
- Maxwell-Boltzmann distribution curves illustrate how temperature affects the number of particles with energy greater than .
- Catalysts increase reaction rate by providing an alternative reaction pathway with a lower .
- Energy profiles show the effect of catalysts on activation energy for endothermic and exothermic reactions.
How it is examined
Maxwell-Boltzmann sketches are 2 to 3 marks and are marked strictly: the curve must start at the origin, not touch the x-axis at high energy, and the two curves at different temperatures must cross once with the higher-temperature curve having a lower, broader peak. A catalyst does not change the curve, it moves the Ea line, and drawing a new curve for a catalyst loses the mark. At HL, deducing a rate equation from an initial-rates table is a 2 to 3 mark chain, and the units of k are a separate mark that students routinely leave off. May 2025 HL Paper 2 TZ1 asked candidates to explain how a catalyst increases the reaction rate [2], to work with the second step of a mechanism [2], and to sketch an energy profile given ΔH and an exothermic assumption [4].
The Arrhenius equation and its linear form, and the gas constant R (HL). What is recall: the shape of a Maxwell-Boltzmann curve and what changes when temperature or Ea changes, how to derive the units of k from the overall order, and the shapes of zero, first and second order graphs.
- 2.2.1 The rate of reaction is expressed as the change in concentration of a particular reactant or product per unit time. Students determine rates of reaction.
- 2.2.2 Species react as a result of collisions of sufficient energy and proper orientation. Students explain the relationship between the kinetic energy of the particles and the temperature in kelvin, and the role of collision geometry.
- 2.2.3 Factors that influence the rate of a reaction include pressure, concentration, surface area, temperature and the presence of a catalyst. Students predict and explain the effects of changing conditions on the rate of a reaction.
- 2.2.4 Activation energy, Ea, is the minimum energy that colliding particles need for a successful collision leading to a reaction. Students construct Maxwell-Boltzmann energy distribution curves to explain the effect of temperature on the probability of successful collisions.
The different mechanisms of homogeneous and heterogeneous catalysts will not be assessed.
- 2.2.6 Many reactions occur in a series of elementary steps. The slowest step determines the rate of the reaction. Students evaluate proposed reaction mechanisms and recognize reaction intermediates, and distinguish between intermediates and transition states, recognizing both in energy profiles.
- 2.2.7 Energy profiles can be used to show the activation energy and transition state of the rate-determining step in a multistep reaction. Students construct and interpret energy profiles from kinetic data.
- 2.2.8 The molecularity of an elementary step is the number of reacting particles taking part in that step. Students interpret the terms "unimolecular", "bimolecular" and "termolecular".
- 2.2.9 Rate equations depend on the mechanism of the reaction and can only be determined experimentally. Students deduce the rate equation for a reaction from experimental data.
Guiding questions
- How can the rate of a reaction be controlled?
Linking questions
- Structure 1.1 What is the relationship between the kinetic molecular theory and collision theory?
- Tool 1, 3, Inquiry 2 Concentration changes in reactions are not usually measured directly. What methods are used to provide data to determine the rate of reactions? What experiments measuring reaction rates might use time as i) a dependent variable ii) an independent variable? (HL) What measurements are needed to deduce the order of reaction for a specific reactant?
- Nature of science, Tool 3, Inquiry 3 How can graphs provide evidence of systematic and random error?
- Reactivity 2.3 What is the relative effect of a catalyst on the rate of the forward and backward reactions?
- Structure 3.1 (HL) What are the features of transition elements that make them useful as catalysts?
- Reactivity 3.4 (HL) Which mechanism in the hydrolysis of halogenoalkanes involves an intermediate? What are the rate equations and units of k for the reactions of primary and tertiary halogenoalkanes with aqueous alkali?
- Nature of science (HL) Why are reaction mechanisms only considered as "possible mechanisms"?
Practice questions
29 questions · 15 easy · 12 medium · 2 hardQuestion 1
EasyPaper 2 · calculator1 markA student is investigating the rate of reaction between solutions of potassium iodide and hydrogen peroxide, which produces iodine. A small amount of starch indicator is added to the mixture. The reaction is observed by timing how long it takes for a distinct blue-black colour to appear. In one experiment, it takes for the blue-black colour to become visible. What is the average rate of reaction for this experiment?
A
B
C
D impossible to calculate from the data
The rate of reaction can often be expressed as the reciprocal of the time taken for a noticeable change to occur.
Question 2
MediumPaper 1B · calculator8 marksAn experiment was conducted to investigate the effect of temperature on the rate of reaction between excess calcium carbonate chips and 100 cm³ of 0.5 mol dm⁻³ hydrochloric acid. The volume of carbon dioxide gas produced was collected in a gas syringe. The results for the reaction at 25 °C (Experiment 1), 35 °C (Experiment 2), and 45 °C (Experiment 3) are plotted on the graph below.
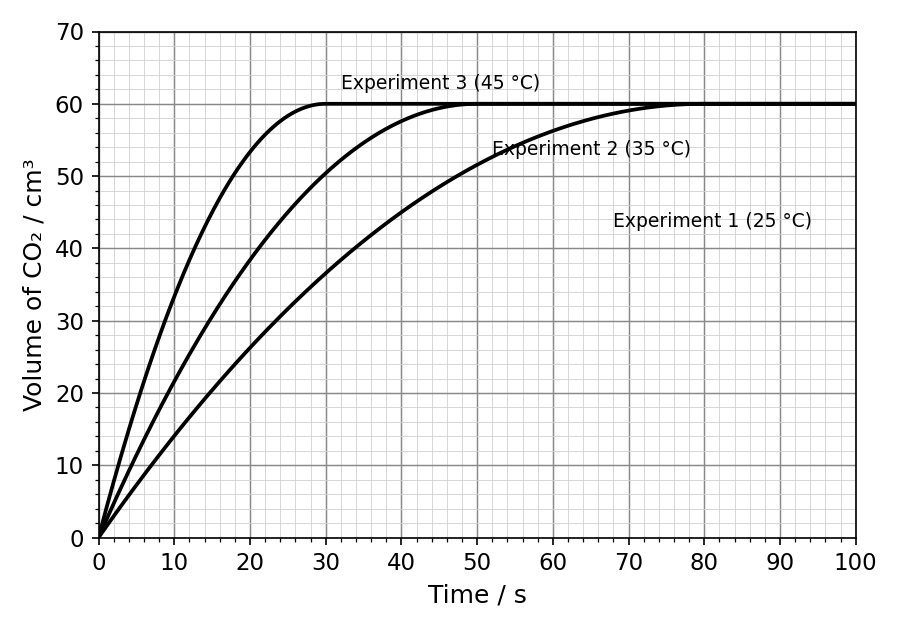
(a) By annotating the graph, determine the initial rate of reaction for Experiment 2, in cm³ s⁻¹.
(b) Estimate the time required for Experiment 1 to produce half of the total volume of CO₂.
(c) Suggest two reasons, in terms of collision theory, why the rate of reaction in Experiment 3 (45 °C) is greater than in Experiment 1 (25 °C).
(d) Calculate the percentage increase in the volume of CO₂ produced after 20 seconds when the temperature is increased from 25 °C (Experiment 1) to 45 °C (Experiment 3).
(e) The experiment was performed in a sealed flask connected to the gas syringe. Sketch a graph of the total mass of the apparatus against time for Experiment 1 and provide a reason for its shape.
To find the initial rate of reaction from a curve, you need to find the gradient of the curve at the very beginning (at time t=0). How do you calculate the gradient of a curve at a specific point?
First, identify the final volume of gas produced from the graph. Then, find half of this value on the y-axis and read the corresponding time from the curve for Experiment 1.
Think about how increasing temperature affects the movement of particles and the energy they possess. How does this relate to the requirements for a successful collision?
Read the volumes for Experiment 1 and Experiment 3 at t=20s from the graph. Then use the formula for percentage increase: ((New Value - Original Value) / Original Value) × 100%.
The apparatus consists of the flask, reactants, and the attached syringe. Consider whether any matter can enter or leave this entire system during the reaction. What law governs this?
Question 3
HardPaper 1B · calculator12 marksA student investigates the decomposition of hydrogen peroxide, H₂O₂, in a commercial antiseptic solution when exposed to light over a period of 7 days. The reaction is:
The concentration of H₂O₂ is determined by titration with a standard solution of acidified potassium manganate(VII), KMnO₄. Several identical flasks are prepared. One flask is kept in darkness, while others are exposed to a light source for different durations each day.
(a) Identify two variables, other than the volume of the solution, that should be controlled in this experiment.
(b) (i) The antiseptic solution is diluted with deionized water before titration. Suggest why this is necessary.
(b) (ii) Identify a possible systematic error associated with the control sample kept in darkness.
(b) (iii) Suggest how the experimental setup could be improved to check if the systematic error identified in (b)(ii) is significant.
(c) The following data are collected for one of the titrations:
Final burette reading =
Initial burette reading =
Calculate the percentage uncertainty of the titre.
(d) The initial concentration of H₂O₂ in all flasks was . The concentration after 7 days was measured for each flask.
| Daily light exposure / hours | Final [H₂O₂] after 7 days / |
|---|---|
| 0 (darkness) | 0.85 |
| 1 | 0.76 |
| 2 | 0.61 |
| 4 | 0.34 |
(i) Calculate the average rate of decrease in hydrogen peroxide concentration, in , for the sample exposed to light for 4 hours daily over the 7-day period.
(d) (ii) The student's hypothesis is: "A greater decrease in hydrogen peroxide concentration will be observed in solutions exposed to light for longer durations, due to photochemical decomposition."
Discuss, with reference to the data, the extent to which the results support this hypothesis.
(d) (iii) State one implication of the results for the storage of hydrogen peroxide solutions.
(e) Suggest a relevant extension to this investigation that would provide further information on the stability of hydrogen peroxide solutions.
Think about the factors that could affect the rate of a chemical reaction. Which of these should be kept constant to ensure a fair test comparing the effect of light exposure?
Consider the practical aspects of a titration. What problems might arise if the solution being titrated (the analyte) is very concentrated?
A systematic error is a flaw in the experimental design that causes results to be consistently incorrect in one direction. How might the 'darkness' condition not be perfectly achieved?
Think about how you could make the 'darkness' condition more robust or how you could measure the baseline decomposition without any experimental handling.
First, calculate the titre by subtracting the initial reading from the final reading. Then, find the absolute uncertainty of the titre by adding the uncertainties of the two readings. Finally, use the formula for percentage uncertainty.
The average rate of decrease is the total change in concentration divided by the total time. Use the data for the 4-hour exposure.
A 'discuss' question requires you to consider both sides. Does the data show a trend that matches the first part of the hypothesis? Does the experiment provide conclusive evidence for the reason given in the second part of the hypothesis?
Based on your results, what is the best way to store a solution of hydrogen peroxide to minimize its decomposition?
Think of another variable, apart from light, that might affect the rate of decomposition of hydrogen peroxide. How would you investigate it?
Question 4
EasyPaper 2 · calculator1 markA student investigates the rate of reaction between magnesium ribbon and hydrochloric acid. Which factor will not alter the rate of this reaction?
A. Using magnesium powder instead of magnesium ribbon.
B. Increasing the temperature of the hydrochloric acid.
C. The standard enthalpy change of reaction, .
D. Increasing the concentration of the hydrochloric acid.
Consider the factors that influence the frequency and energy of particle collisions. One of these options relates to the overall energy difference between reactants and products, not the path taken to get there.
Question 5
MediumPaper 2 · calculator1 markThe reaction between magnesium metal and hydrochloric acid is investigated:
Which of the following changes will not increase the initial rate of this reaction?
A. Replacing a strip of magnesium with the same mass of magnesium powder.
B. Increasing the temperature of the hydrochloric acid.
C. Increasing the concentration of the hydrochloric acid.
D. Increasing the volume of the hydrochloric acid while keeping its concentration constant.
The initial rate of reaction depends on factors that affect the frequency and energy of collisions between reactant particles. Consider which of the options does not alter these factors at the start of the reaction.
Question 6
HardPaper 2 · calculator12 marksA student investigated the effectiveness of three different brands of antacid tablets (Brand A, Brand B, and Brand C) in neutralizing hydrochloric acid, which simulates stomach acid. The active ingredient in all three brands is calcium carbonate, .
The following procedure was used for each brand:
1. One tablet was crushed using a mortar and pestle.
2. The crushed tablet was transferred to a conical flask containing of HCl(aq). This is an excess of acid.
3. The mixture was stirred for a fixed time until the reaction appeared complete.
4. The resulting solution was titrated with NaOH(aq) using a suitable indicator.
5. The experiment was repeated three times for each brand.
(a) State the independent and dependent variables for this investigation.
(b) Suggest two experimental conditions, other than the volumes and concentrations of the acid and alkali, that must be controlled to ensure a fair comparison between the brands.
(c) Suggest a reason for crushing the tablet before adding it to the acid.
The average results for the titrations are shown in the table.
| Brand of Antacid | Average volume of NaOH added / |
|---|---|
| A | 28.55 |
| B | 21.10 |
| C | 29.20 |
(d) Based on the data, deduce which brand of antacid is the most effective, giving a reason.
(e) Calculate the amount, in mol, of HCl neutralized by one tablet of Brand B.
(f) The manufacturer of Brand A claims their tablet contains of calcium carbonate, . Determine if the student's results for Brand A support this claim. The equation for the reaction is: .
The independent variable is the one the experimenter chooses to change. The dependent variable is the one that is measured in response to this change.
Consider factors that could influence the rate or extent of the reaction between the solid tablet and the acid.
Think about the factors that affect the rate of a chemical reaction involving a solid reactant.
The most effective antacid neutralizes the most acid. This means less acid will be left over to react with the NaOH in the back-titration.
This is a back-titration calculation. First, find the initial moles of HCl. Then, find the moles of NaOH used to titrate the excess HCl. The difference will be the moles of HCl that reacted with the antacid.
Use the data for Brand A to find the moles of HCl it neutralized. Then use the reaction stoichiometry to find the corresponding moles, and then mass, of . Compare this experimental mass to the manufacturer's claim.
Question 7
EasyPaper 2 · calculator1 markIn the industrial synthesis of sulfuric acid, vanadium(V) oxide () is used as a catalyst for the reaction: . What is the effect of the catalyst on this reaction?
A. It increases the activation energy of the forward reaction.
B. It increases the equilibrium constant () for the reaction.
C. It provides an alternative reaction pathway with a lower activation energy.
D. It makes the forward reaction more exothermic.
Consider the energy profile of a reaction. A catalyst changes the path from reactants to products but does not change the initial or final energy states.
Question 8
MediumPaper 2 · calculator10 marksA student investigates the rate of reaction between magnesium and sulfuric acid. The reaction produces hydrogen gas.
(a) Write the balanced chemical equation, including state symbols, for the reaction between magnesium and sulfuric acid.
(b) Describe two different experimental methods to measure the rate of this reaction. For each method, state the variable that would be measured.
The student carries out the reaction using 0.50 g of magnesium and excess 1.0 mol dm⁻³ sulfuric acid. The experiment is performed twice: once with a single ribbon of magnesium and once with the same mass of magnesium powder. The results are plotted on the graph below.
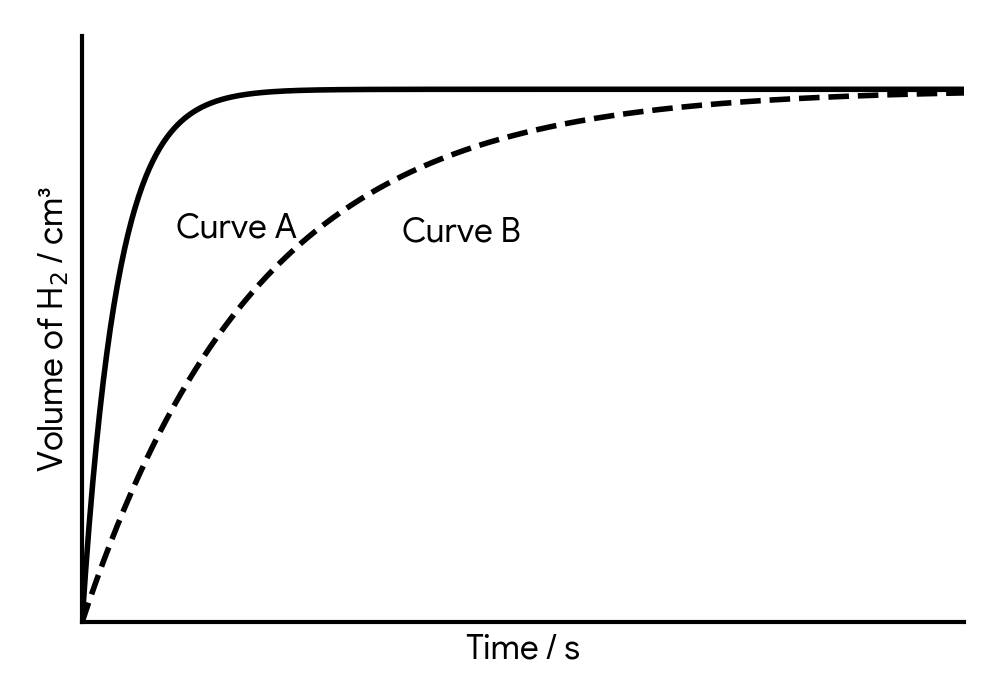
(c) (i) Identify which curve, A or B, represents the reaction with magnesium powder. Explain your answer using collision theory.
(ii) Explain why both curves reach the same final volume of hydrogen gas.
Identify the products of the reaction between a metal and an acid. Remember to include the physical state of each reactant and product at room temperature.
The reaction produces a gas and involves a solid reactant disappearing. How could you measure the change in the amount of gas over time? How could you measure the change in the total mass of the reaction system over time?
Consider how the surface area of the magnesium differs between a ribbon and a powder. How does surface area affect the rate of collisions between reactant particles?
Think about what determines the total amount of product formed in a reaction. Which reactant runs out first? Is the amount of this reactant the same in both experiments?
Question 9
EasyPaper 2 · calculator1 markThe Contact process is used for the industrial production of sulfuric acid. One key step is the reversible reaction between sulfur dioxide and oxygen, catalysed by vanadium(V) oxide:
What is the effect of the vanadium(V) oxide catalyst on this reaction?
A. It increases the equilibrium yield of sulfur trioxide.
B. It increases the value of the equilibrium constant, .
C. It increases the rate at which equilibrium is attained.
D. It decreases the enthalpy change, , for the forward reaction.
Consider the definition of a catalyst. How does a catalyst affect the rate of a reaction and the position of equilibrium?
Question 10
MediumPaper 2 · calculator5 marksSulfur trioxide, , is a key intermediate in the industrial production of sulfuric acid. It is produced by the reversible reaction of sulfur dioxide, , and oxygen, , in the Contact process.
(a) State the effect of increasing the pressure on the rate of the forward reaction, assuming the temperature is kept constant.
(b) Explain your answer to (a) using collision theory.
(c) The reaction is typically carried out in the presence of a vanadium(V) oxide, , catalyst. State the effect of the catalyst on the rate of the reaction and explain how it achieves this effect.
How does pressure affect the spacing between gas particles? What does this mean for how often they might react?
Collision theory has two main requirements for a reaction to occur. Which one is primarily affected by a change in pressure?
Think about what a catalyst does to the energy profile of a reaction. How does this change the number of successful collisions?
Question 11
EasyPaper 1A · calculator1 markThe diagram shows the Maxwell-Boltzmann distribution of molecular energies for a gaseous reaction. represents the activation energy for the uncatalysed reaction.
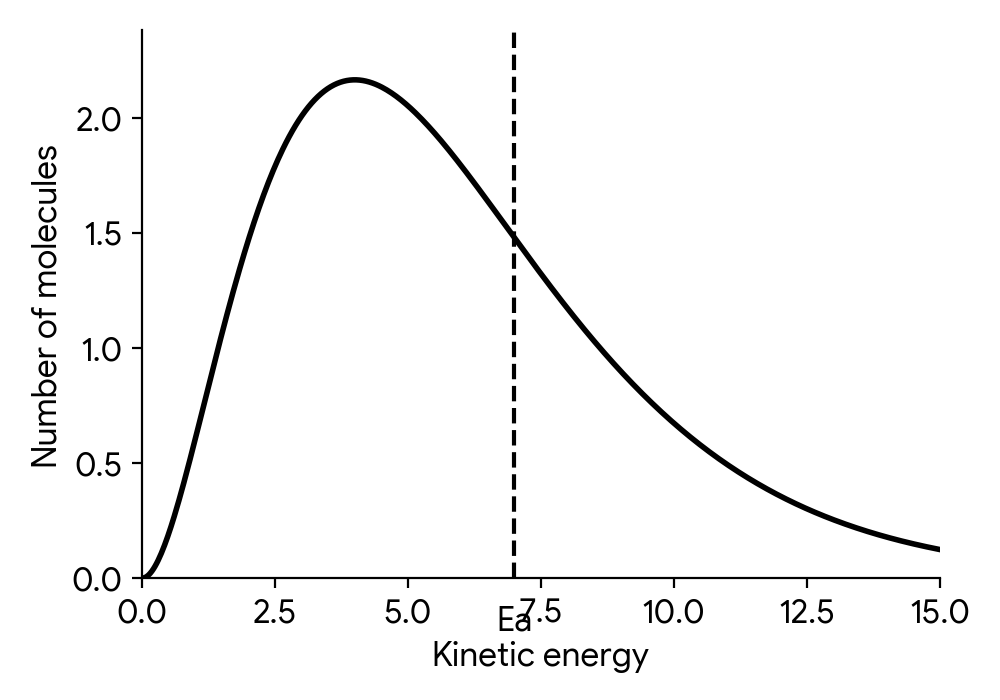
Which diagram correctly shows the distribution of molecular energies and the activation energy, , when a catalyst is added?
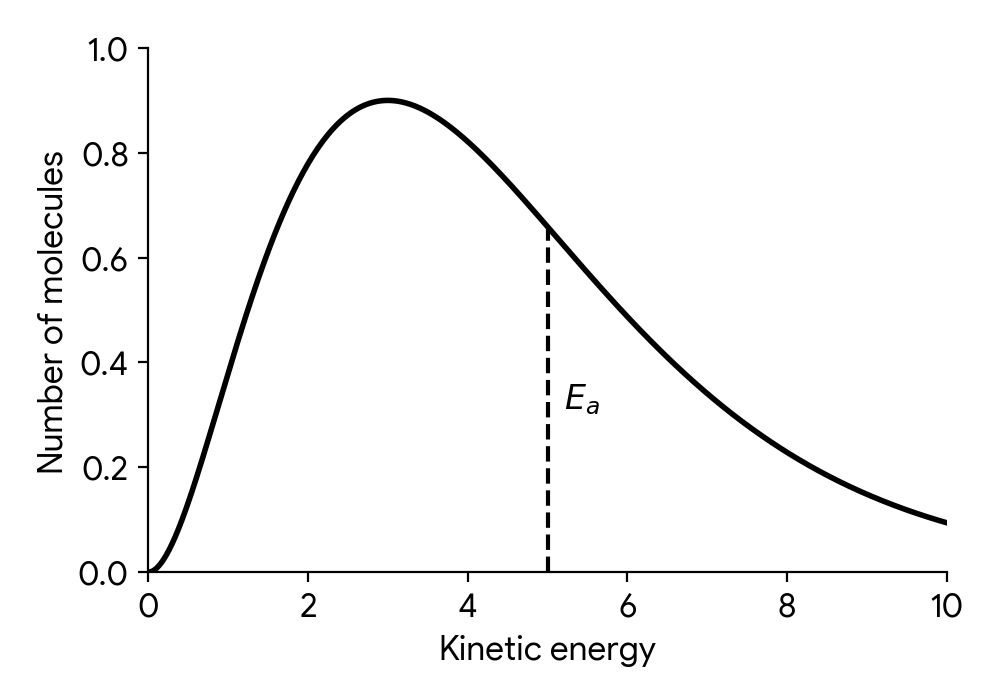
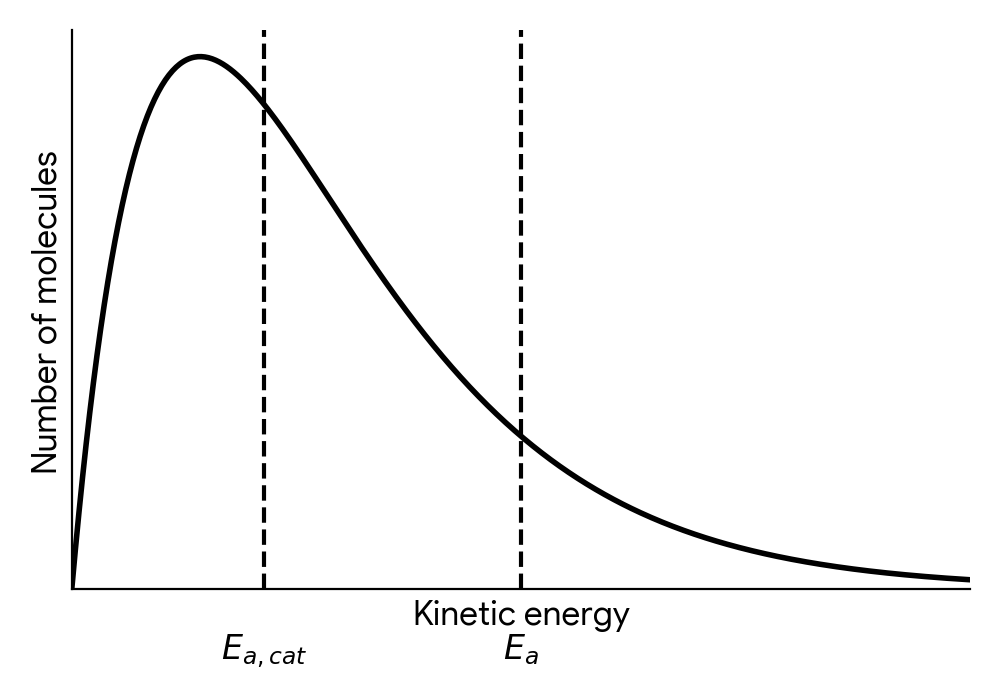
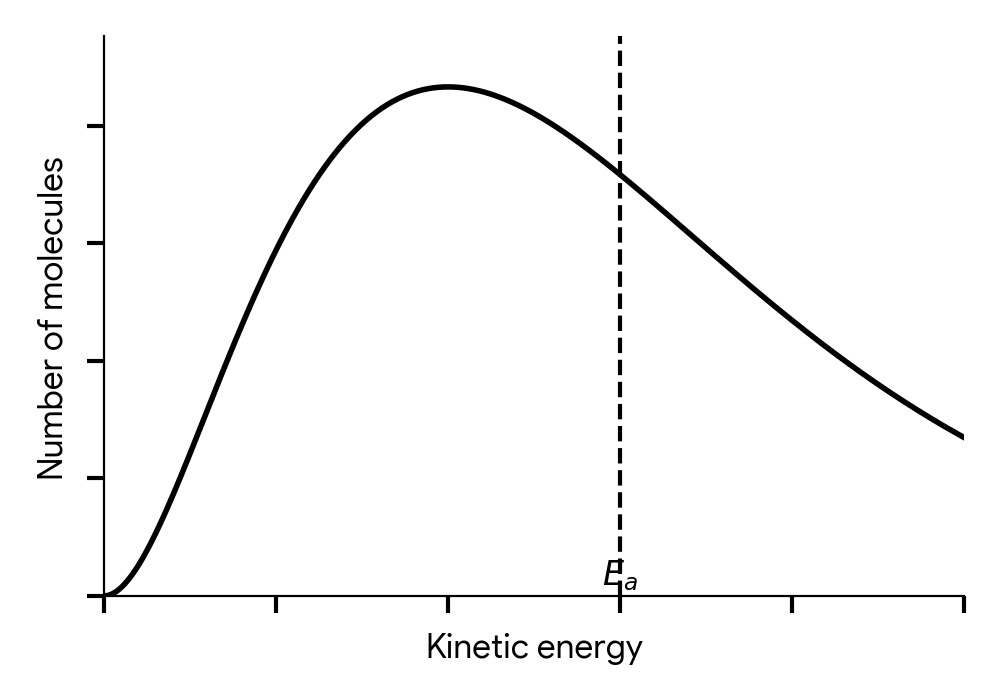
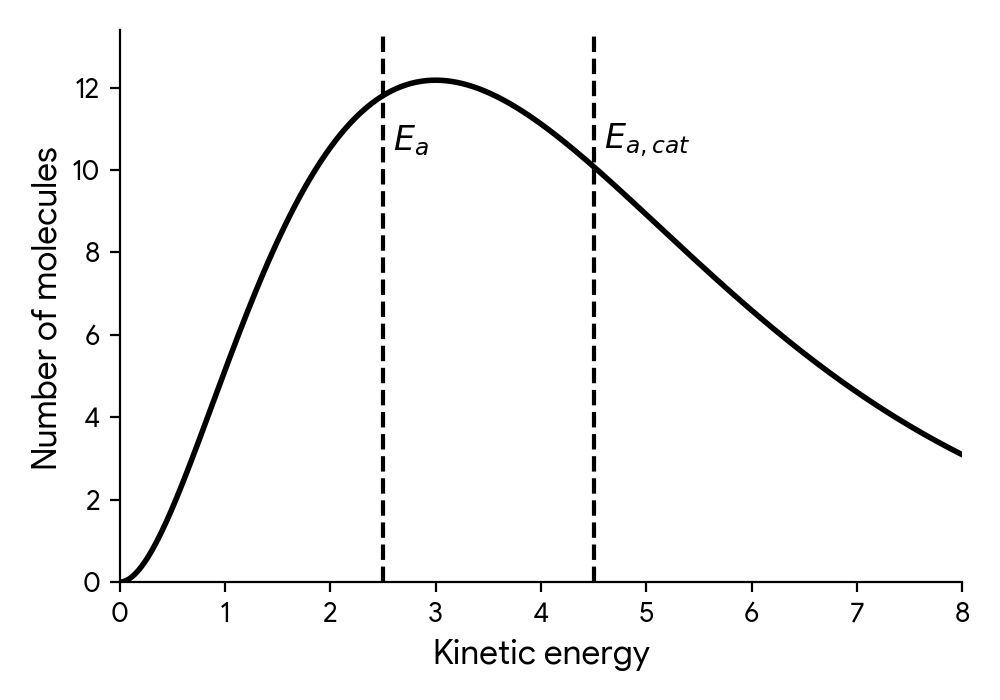
Consider the two main factors that affect the rate of a reaction: temperature and the use of a catalyst. How does a catalyst work? Does it change the kinetic energy of the molecules, or does it provide a different pathway for the reaction?
Question 12
MediumPaper 1A · calculator1 markWhich changes will increase the rate of the forward reaction in the Haber process?
I. Addition of an iron catalyst
II. Increasing the pressure
III. Decreasing the temperature
A. I and II only
B. I and III only
C. II and III only
D. I, II and III
Consider how each factor, catalyst, pressure, and temperature, affects the frequency and energy of collisions between reactant particles. Be careful to distinguish between factors affecting the rate of reaction and factors affecting the position of equilibrium.
Question 13
EasyPaper 1A · calculator1 markA chemist is investigating the decomposition of a coloured compound, X, in solution. The initial concentration of X was . After , the concentration of X was measured to be .
What is the average rate of decomposition of X during this time interval?
A.
B.
C.
D.
The average rate of reaction can be calculated by dividing the change in concentration of a reactant or product by the time interval over which the change occurred. Remember to consider the stoichiometry if applicable, but for a single reactant's decomposition, it's simply .
Question 14
MediumPaper 1A · calculator1 markWhich apparatus can be used to monitor the progress of the reaction between acidified potassium permanganate(VII) and sodium ethanedioate?
I. A colorimeter
II. A gas syringe
III. A pH meter
A. I and II only
B. I and III only
C. II and III only
D. I, II and III
Consider the properties of the reactants and products. Is there a change in colour? Is a gas produced? Is there a change in the concentration of ions?
Question 15
EasyPaper 1A · calculator1 markThe Maxwell-Boltzmann energy distribution curve for a gaseous reaction at a fixed temperature is shown.
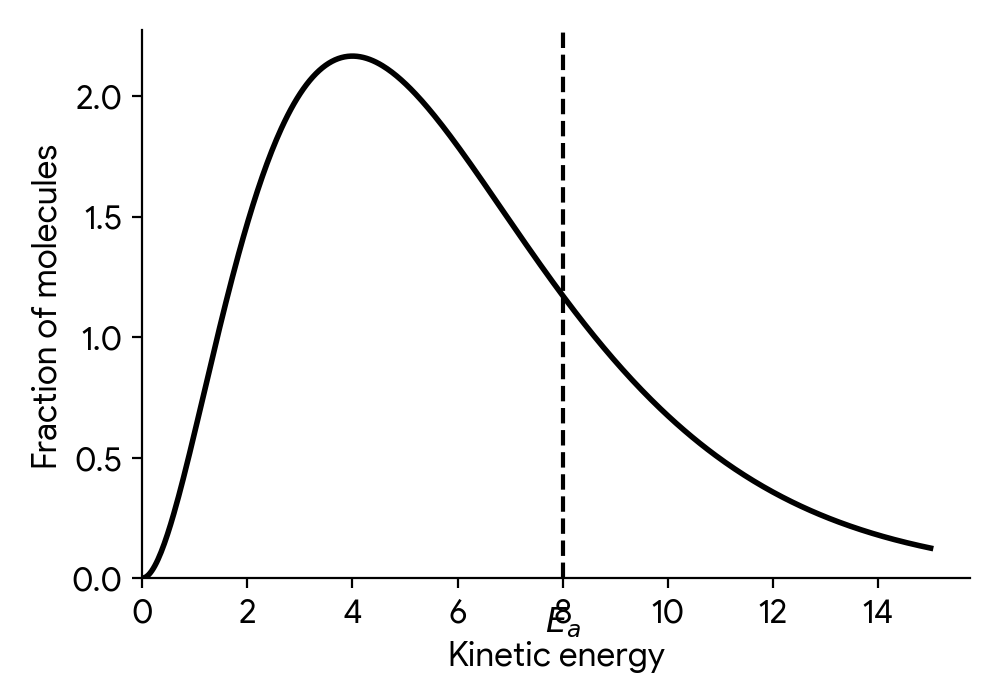
What is the effect of adding a catalyst to this reaction, while keeping the temperature constant?
A. The peak of the curve shifts to the right and the activation energy, , decreases.
B. The peak of the curve remains unchanged and the activation energy, , increases.
C. The peak of the curve remains unchanged and the activation energy, , decreases.
D. The peak of the curve flattens and the activation energy, , remains unchanged.
A catalyst provides an alternative reaction pathway. How does this affect the activation energy? Does a catalyst change the temperature of the system or the kinetic energy distribution of the particles?
Question 16
MediumPaper 1A · calculator1 markThe Haber process for the synthesis of ammonia is represented by the equation: . The reaction is exothermic and requires a catalyst, indicating a high activation energy for the uncatalysed reaction.
Which potential energy profile best represents the forward uncatalysed reaction of the Haber process?
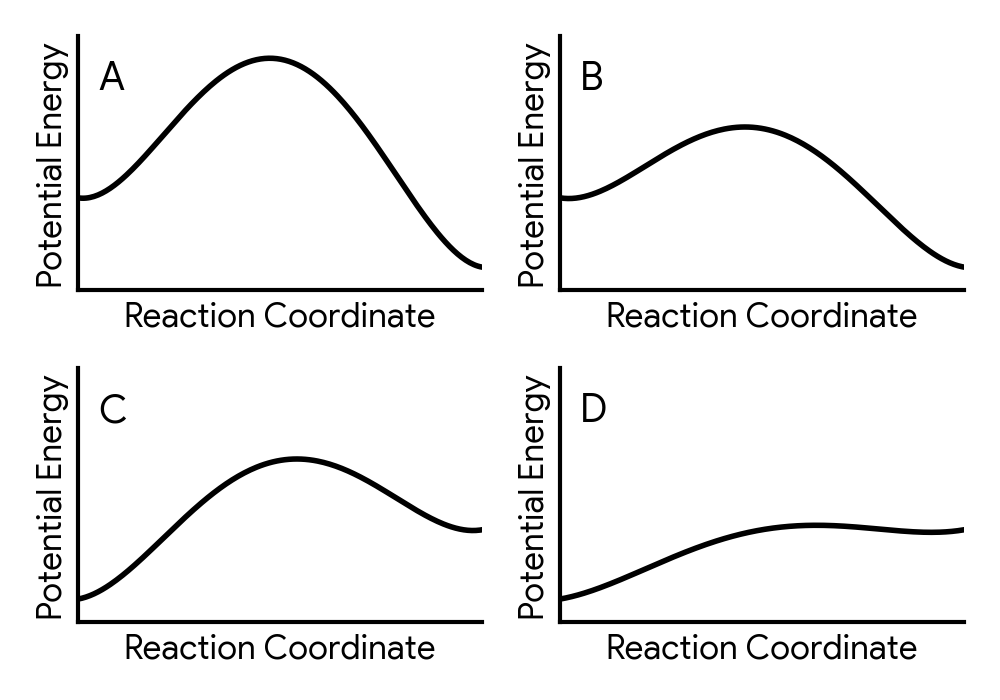
Consider what 'exothermic' means for the relative potential energy of reactants and products. Then, consider what 'high activation energy' implies about the energy barrier shown on the profile.
Question 17
EasyPaper 1A · calculator1 markFor a reaction that is zero-order with respect to a reactant, what are the units of the rate constant, k?
A.
B.
C.
D.
Recall the general rate equation: rate = k[A]^n. For a zero-order reaction, n=0. What are the units for the rate of reaction itself?
Question 18
MediumPaper 1A · calculator1 markThe decomposition of dinitrogen pentoxide occurs in a closed container according to the following equation:
The graph shows the change in concentration of oxygen gas, , over time.
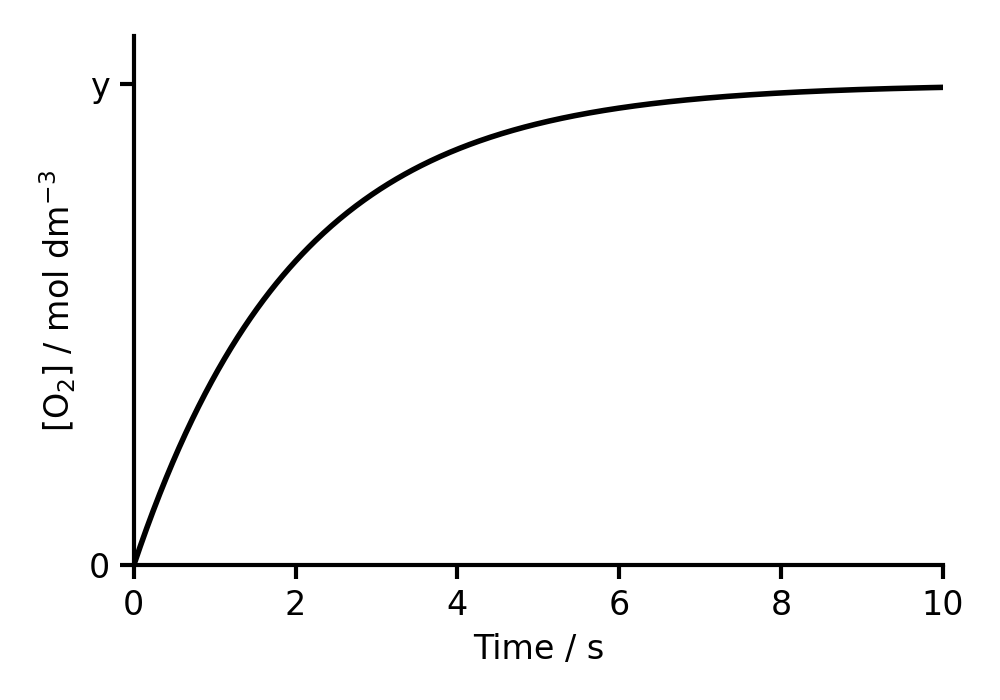
Which graph correctly shows the change in concentration of dinitrogen pentoxide, , over the same period?
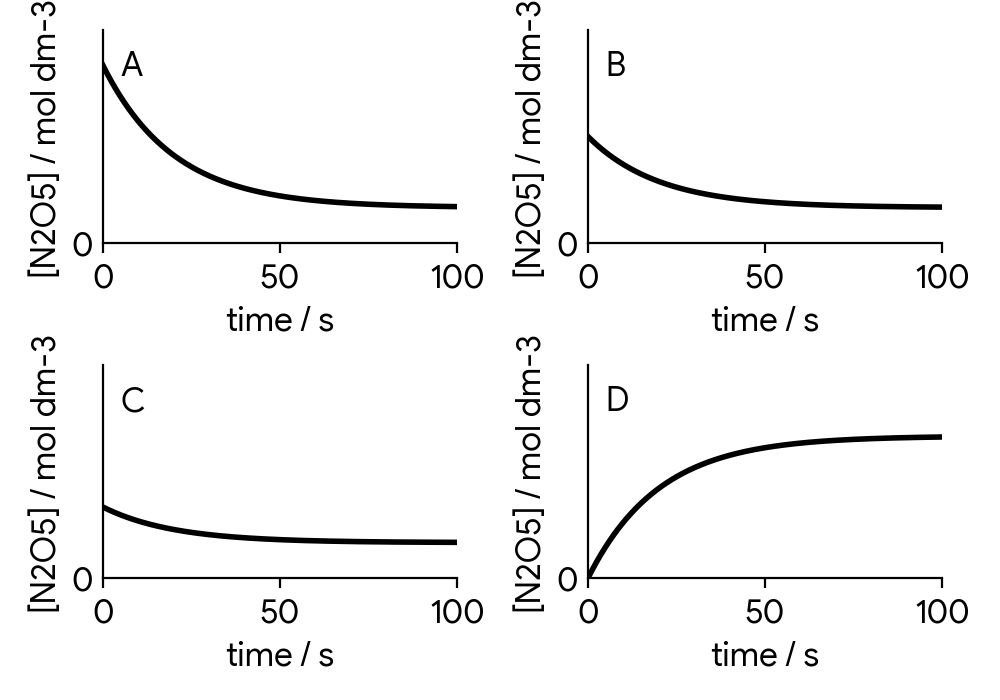
Consider the stoichiometric ratio between and in the balanced equation. How does this ratio affect the relative rates at which their concentrations change, and therefore the total change in their concentrations?
Question 19
EasyPaper 1A · calculator1 markWhat is the primary reason a catalyst increases the rate of a chemical reaction?
A. It increases the kinetic energy of the reactant molecules
B. It provides an alternative reaction pathway with a lower activation energy
C. It increases the frequency of collisions between reactant molecules
D. It makes the reaction more exothermic
Consider the effect of a catalyst on the energy profile of a reaction. Does it alter the energy of the reactant particles or the energy barrier for the reaction?
Question 20
MediumPaper 1A · calculator1 markWhich changes increase the rate of the forward reaction?
I. Adding a vanadium(V) oxide catalyst
II. Increasing the volume of the reaction vessel
III. Increasing the partial pressure of
A. I and II only
B. I and III only
C. II and III only
D. I, II and III
Consider how each change affects the frequency of successful collisions between reactant particles. For gases, how are volume and partial pressure related to concentration?
No question on this page matches those filters. Try another difficulty or paper.
9 more How fast? the rate of chemical change questions in the app
Every answer is marked mark by mark, IB-style, and the AI tutor helps when you are stuck.
Where marks are lost
- Reaching for "human error" or "only one trial." A source of error has to be a specific step in the method, not a general apology for the result.
- Joining the dots instead of drawing a curve.
- Naming a chemical instead of the property that distinguishes it, or vice versa. Answering with the nearest fact that comes to mind rather than the fact the command term and stem jointly ask for is a recurring way to answer a question that was not, quite, the one asked.
