Technology: notes and practice questions
- This topic covers the application of technology in collecting and processing chemical data.
- Technology can be used to collect data through sensors, by identifying and extracting data from databases, and by generating data from models and simulations.
- Technology can be used to process data by manipulating it with spreadsheets, representing it in graphical form, and using computer modelling.
How it is examined
Rarely on its own. It shows up folded into Paper 1B stems that describe an experiment run with a sensor or a datalogger, and in single-mark parts asking why a probe was chosen over an indicator. Tariff 1 to 2 marks.
- Apply technology to collect data: use sensors, identify and extract data from databases, generate data from models and simulations.
- Apply technology to process data: use spreadsheets to manipulate data, represent data in a graphical form, use computer modelling.
No additional higher level content in Tool 2.
Guiding questions
- None given. The tools carry no guiding question.
Linking questions
- Structure 1.5 Graphs can be presented as sketches or as accurately plotted data points. What are the advantages and limitations of each representation?
- Structure 3.1 Why are simulations often used in exploring the trends in chemical reactivity of group 1 and group 17 elements?
- Structure 3.2 How useful are 3D models (real or virtual) to visualize the invisible?
- Reactivity 3.1 When are digital sensors (e.g. pH probes) more suitable than analogue methods (e.g. pH paper/solution)?
Practice questions
11 questions · 2 easy · 8 medium · 1 hardQuestion 1
EasyPaper 1A · calculator1 markA student investigates the temperature change during a rapid exothermic reaction. The procedure requires continuous measurement of temperature every 0.2 s for 3 minutes.
Which technological tool is most appropriate for collecting this data?
A. A datalogger connected to a temperature probe
B. A spreadsheet program
C. An online chemical database
D. Molecular modelling software
Consider which tool is specifically designed for automated, high-frequency physical data acquisition during an experiment, rather than for data manipulation or theoretical simulation.
Question 2
MediumPaper 1B · calculator3 marksA student investigates the neutralisation reaction between dilute ethanoic acid, , and sodium hydroxide solution, .
The student considers two methods to monitor the progress of the reaction:
- Method A: Adding universal indicator solution to the reaction mixture and visually observing the colour change.
- Method B: Using a digital pH probe connected to a data logger to continuously record the pH as sodium hydroxide solution is added from a burette.
(a) Outline one advantage of using a data logger to continuously record the pH in Method B rather than recording values manually.
(b) Evaluate the suitability of using the digital pH probe in Method B compared to universal indicator in Method A for identifying the equivalence point of this titration.
Consider the frequency of readings a data logger can collect automatically compared to writing down values by hand, or how the data is plotted.
An evaluation must address both a strength and a limitation. Think about how easy it is to pinpoint the exact equivalence point using numerical values versus a gradual colour change, and consider what practical preparation a digital sensor requires before use.
Question 3
HardPaper 2 · calculator23 marksA sample of chlorine consists of two isotopes, and .
(a) Contrast the sub-atomic structure of these two isotopes.
(b) (i) The sample of chlorine is analysed in a mass spectrometer, producing a spectrum for the ion. The spectrum shows three peaks at m/z values of 70, 72 and 74. Explain the origin and relative heights of these three peaks, given that the abundance of is approximately three times that of .
(ii) A more precise measurement finds the composition by mass to be: : 75.76%, : 24.24%. Calculate the relative atomic mass of chlorine from this sample, giving your answer to two decimal places. (Use isotopic masses of 35.0 and 37.0 for this calculation).
Magnesium chloride, , and manganese(II) chloride, , are two ionic compounds.
(c) (i) Deduce the type of bonding in magnesium chloride, , using electronegativity values from section 9 of the data booklet.
(ii) Determine the lattice enthalpy of magnesium chloride, assuming the bonding is purely ionic. Use sections 9, 10 and 12 of the data booklet and the following data:
Enthalpy of formation of magnesium chloride =
(iii) Explain, with reference to electron configurations, why the ionic radii of , and are different. Use section 10 of the data booklet.
(iv) Predict, with a reason, which has the stronger ionic bonding, manganese(II) chloride, , or magnesium chloride.
Magnesium chloride is white, but manganese(II) chloride is pale pink.
(d) (i) State the condensed electron configuration of a manganese atom.
(ii) State the reason, in terms of electron configuration, why manganese(II) chloride is coloured.
(iii) Manganese(II) chloride absorbs light with a wavelength of approximately 530 nm. Describe why this is consistent with the observed colour of the compound. Use sections 2 and 15 of the data booklet.
A copper key is to be electroplated with manganese using an aqueous solution of manganese(II) chloride as the electrolyte.
(e) (i) Deduce the half-equations for the reactions occurring at the anode (made of pure manganese) and the cathode (the copper key).
(ii) Deduce a balanced chemical equation for the reaction of fluorine gas with the aqueous chloride ions in the electrolyte.
Isotopes of an element have the same number of protons but a different number of another sub-atomic particle. What is this particle and how does its number differ between and ?
The peaks correspond to different combinations of the two chlorine isotopes in a diatomic molecule. The height of each peak is related to the probability of that specific combination occurring. Consider the relative abundances of the isotopes.
The relative atomic mass is the weighted average of the isotopic masses. Multiply each isotopic mass by its fractional abundance and sum the results.
Find the electronegativity values for magnesium and chlorine. The difference in their electronegativity values will indicate the type of bonding.
Construct a Born-Haber cycle for the formation of from and . Use Hess's Law to find the unknown lattice enthalpy. Remember to account for the stoichiometry, especially for chlorine.
Compare the number of electron shells and the nuclear charge (number of protons) for each ion.
The strength of ionic bonding depends on the charge of the ions and the distance between them (ionic radii). Compare these factors for and .
Manganese is in the first row of the d-block. Remember the filling order of the 4s and 3d sub-levels.
The colour of transition metal compounds is related to the electronic structure of the transition metal ion. What is special about the d-sublevel in coloured ions?
The colour we see is the complementary colour to the one that is absorbed. Use the colour wheel in the data booklet to find the complementary colour of the absorbed light.
In electroplating, the object to be plated is the cathode, and the metal used for plating is the anode. Oxidation occurs at the anode and reduction occurs at the cathode.
Consider the relative oxidizing strengths of the halogens. A more reactive halogen will displace a less reactive halide from its salt solution.
Question 4
EasyPaper 1A · calculator1 markA student collects a large set of concentration–time data during a chemical reaction. The student needs to calculate the rate of reaction at multiple points and construct a concentration–time graph.
Which technological tool is most appropriate for processing this data?
A. A spreadsheet program
B. An online chemical database
C. Molecular modelling software
D. A computer simulation
Consider which tool is designed to store numerical tables, apply automated formulas across columns of measurements, and plot graphs from experimental results.
Question 5
MediumPaper 1B · calculator3 marksA student investigates the enthalpy change of neutralisation by reacting of with of in an insulated polystyrene cup.
The student considers two methods for recording the temperature of the reaction mixture over time:
- Method A: Using a liquid-in-glass thermometer and manually recording the temperature at intervals.
- Method B: Using a digital temperature probe connected to a datalogger recording the temperature continuously every .
(a) Outline why the digital temperature probe should be calibrated before the experiment is carried out.
(b) Evaluate the suitability of Method B compared to Method A for determining the maximum temperature change in this reaction.
Consider what type of experimental error can arise if a sensor has an offset, and how calibration ensures the measured values reflect the true temperature.
Weigh up the method by identifying one clear advantage of continuous digital logging during a rapid reaction and one practical limitation or disadvantage compared to a simple thermometer.
Question 6
MediumPaper 2 · calculator3 marksWhen investigating the trend in reactivity of the Group 1 elements, the reactions of lithium and sodium with water are often demonstrated in a school laboratory. However, the reactions of rubidium and caesium are commonly investigated using computer simulations.
(a) Explain why a computer simulation is preferred over a physical demonstration for the reaction of caesium with water in terms of laboratory safety.
(b) Aside from safety considerations, explain two advantages of using computer simulations or dynamic 3D models to investigate chemical reactions.
Consider the trend in reactivity down Group 1 and the hazards associated with an extremely rapid, exothermic reaction.
Think about what happens at the microscopic level and how simulations allow you to control time and observe particles.
Question 7
MediumPaper 2 · calculator3 marksComputer modelling software is frequently used to visualize the three-dimensional (3D) structures of molecules and simulate chemical reactions.
(a) Explain why a 3D virtual model is more effective than a two-dimensional (2D) Lewis formula on paper when predicting whether a molecule such as dichloromethane, , has an overall molecular dipole moment.
(b) Explain one reason why chemists use computer simulations to study reaction pathways at the molecular level rather than relying solely on direct laboratory observations.
Think about how a molecule is drawn on a flat sheet of paper versus its actual arrangement in space. If you draw the two chlorine atoms opposite each other in a flat 2D drawing, what might you incorrectly assume about whether the bond dipoles cancel?
Consider what happens during a single molecular collision, how fast does it occur, and on what physical scale? Why is it difficult or impossible to watch individual molecules collide and react using standard laboratory instruments?
Question 8
MediumPaper 2 · calculator2 marksA student synthesises a sample of aspirin (acetylsalicylic acid) in the laboratory and purifies it by recrystallisation.
(a) Describe how a database of physical properties can be used to assess the purity of the synthesised product.
(b) Describe how a spectral database can be used to confirm the identity of the synthesised product.
Think about which physical property of a solid is measured to test purity, and what data from a reference database it would be compared against.
Consider how an experimentally obtained spectrum of the product is compared with authentic spectra stored in a database.
Question 9
MediumPaper 2 · calculator4 marksA student investigates the kinetics of a reaction in which an acid is consumed. At regular time intervals, samples of the reaction mixture are withdrawn, quenched, and titrated against standard sodium hydroxide solution to determine the amount of remaining acid. The student records the time of sampling and the raw titre volume for each sample in two columns of a spreadsheet.
(a) Describe how the spreadsheet can be used to manipulate the raw titre volumes into concentrations of acid for each time point.
(b) Describe how the spreadsheet can be used to represent these processed data in a graphical form to determine the initial rate of the reaction.
Consider how a mathematical relationship involving known experimental parameters (such as the titrant concentration and sample volume) can be entered and applied across all rows of data.
Think about the type of chart needed to show the relationship between concentration and time, and how the initial rate is related to the slope at the start of the reaction.
Question 10
MediumPaper 2 · calculator6 marksButan-2-ol, , is a secondary alcohol that can be oxidized using acidified potassium dichromate(VI) solution to produce an organic compound, X.
(a) Identify the organic compound X and state the colour change observed for the oxidizing agent.
(b) The structure of a compound can be confirmed using ¹H NMR spectroscopy. Predict the number of signals and the ratio of the areas under the signals for the ¹H NMR spectrum of butan-2-ol.
(c) Predict the number of signals and the ratio of the areas under the signals for the ¹H NMR spectrum of compound X.
Consider the product formed when a secondary alcohol is oxidized. Recall the characteristic colours of the dichromate(VI) ion and the chromium(III) ion formed upon reduction.
Identify the number of unique proton environments in the butan-2-ol molecule. The ratio of the areas under the signals corresponds to the ratio of the number of protons in each of these unique environments.
First, draw the structure of compound X (butanone). Then, identify the non-equivalent proton environments and count the number of protons in each environment to determine the integration ratio.
Question 11
MediumPaper 1A · calculator1 markBromine is a diatomic molecule. A sample of bromine contains the isotopes and in approximately equal abundance.
Which graph shows the mass spectrum of this sample of bromine?
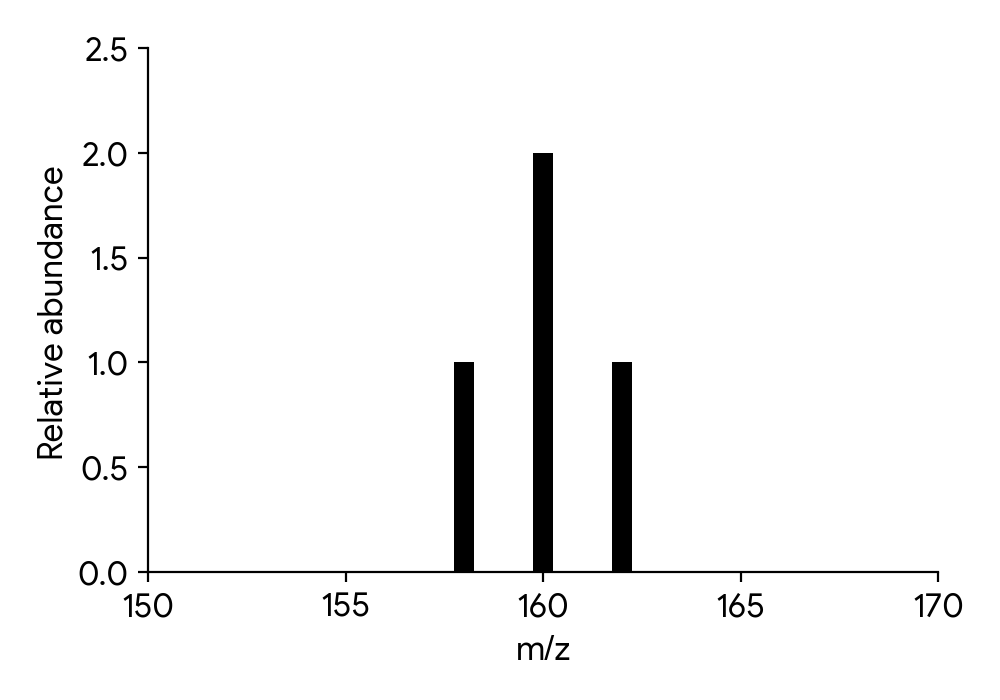
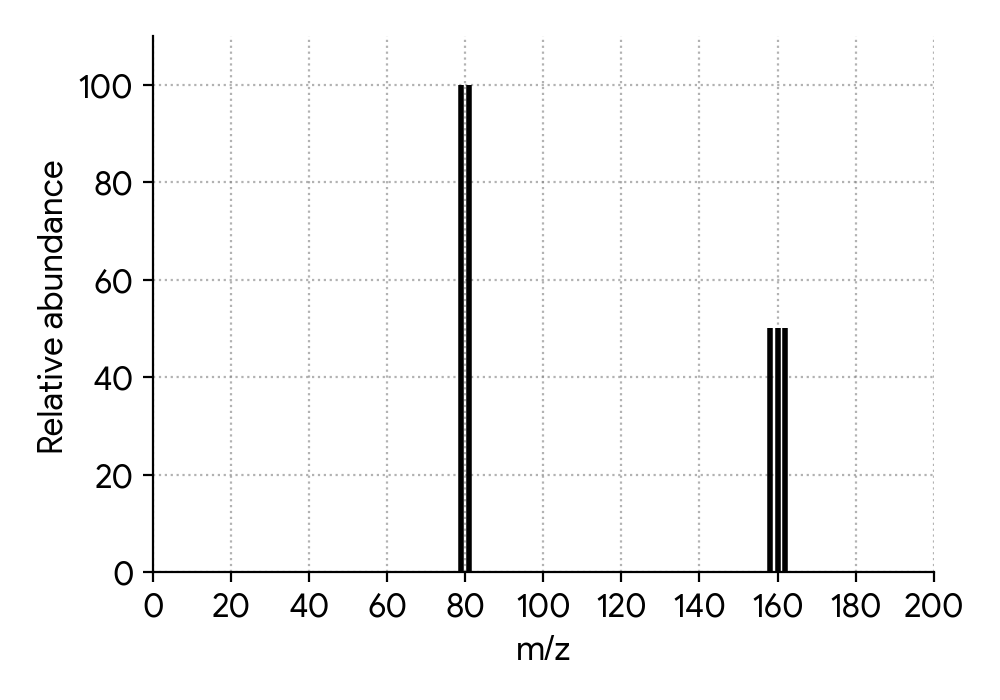
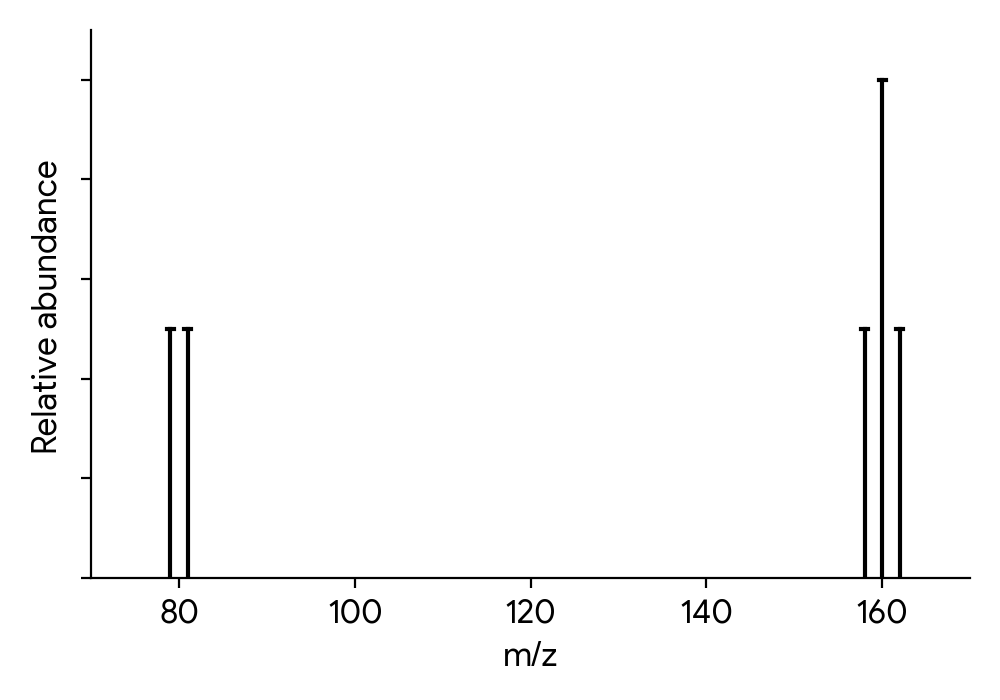
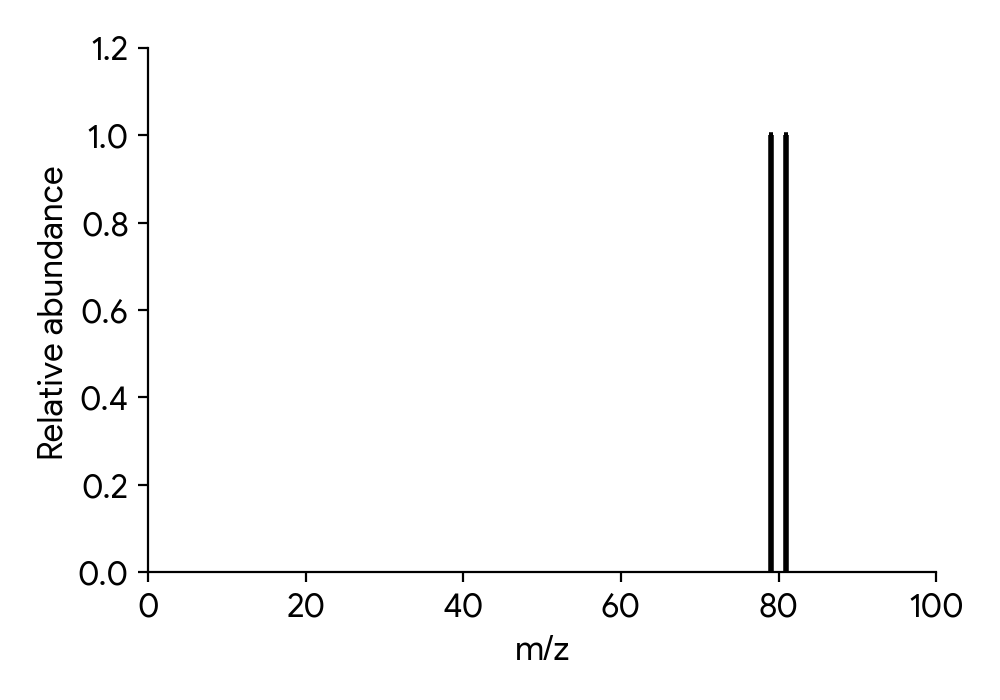
Consider both the atomic ions () and the molecular ions () that will be formed in the mass spectrometer. Remember to account for all possible combinations of the two isotopes in the diatomic molecule and their relative probabilities.
No question on this page matches those filters. Try another difficulty or paper.
Every Technology question, marked for you
Every answer is marked mark by mark, IB-style, and the AI tutor helps when you are stuck.
Where marks are lost
- Reaching for "human error" or "only one trial." A source of error has to be a specific step in the method, not a general apology for the result.
- Joining the dots instead of drawing a curve.
- Naming a chemical instead of the property that distinguishes it, or vice versa. Answering with the nearest fact that comes to mind rather than the fact the command term and stem jointly ask for is a recurring way to answer a question that was not, quite, the one asked.
