Transport: notes and practice questions
- This topic covers the adaptations for transport of substances in animals and plants, including the structure and function of circulatory and vascular systems.
- Capillaries are adapted for efficient exchange with a large surface area, thin walls, and narrow diameters.
- Arteries possess muscle and elastic tissue to withstand and maintain high blood pressure.
- Veins have valves to prevent backflow and flexible walls that allow compression by muscles to aid blood return.
- Water transport in plants occurs via xylem, driven by transpiration, cohesion, and lignified vessel walls.
- Xylem and phloem are organized into vascular bundles in plant stems and roots.
- Skills include distinguishing blood vessels and plant tissues in micrographs, measuring pulse rates, and evaluating epidemiological data.
How it is examined
Xylem transport is one of the highest-yield explain items in the syllabus and the mark scheme wants the chain: evaporation from leaf cell walls, tension, cohesion, continuous column, adhesion to walls. Missing "cohesion" costs a mark almost every time. HL cardiac cycle questions are graph-based and often sit in Paper 1B. Plan diagrams of stem and root are drawn items with strict rules on no individual cells.
- B3.2.1 Adaptations of capillaries for exchange between blood and the internal or external environment: large surface area from branching and narrow diameter, thin walls, and fenestrations in some capillaries where exchange must be rapid.
- B3.2.2 Structure of arteries and veins. Application of skills: distinguish arteries from veins in micrographs by vessel wall structure and its thickness relative to lumen diameter.
- B3.2.3 Adaptations of arteries for transport away from the heart, with layers of muscle and elastic tissue helping them withstand and maintain high blood pressures.
- B3.2.4 Measurement of pulse rates. Application of skills: determine heart rate by feeling the carotid or radial pulse, and compare traditional with digital methods.
- B3.2.11 Release and reuptake of tissue fluid in capillaries. Tissue fluid forms by pressure filtration of plasma, promoted by higher pressure of blood from arterioles; lower pressure in venules lets tissue fluid drain back.
- B3.2.12 Exchange of substances between tissue fluid and cells in tissues, including a discussion of the composition of plasma and tissue fluid.
- B3.2.13 Drainage of excess tissue fluid into lymph ducts, limited to the presence of valves, thin walls with gaps, and the return of lymph to the blood circulation.
- B3.2.14 Differences between the single circulation of bony fish and the double circulation of mammals. Simple circuit diagrams are sufficient.
Guiding questions
- What adaptations facilitate transport of fluids in animals and plants?
- What are the differences and similarities between transport in animals and plants?
Linking questions
- How do pressure differences contribute to the movement of materials in an organism?
- What processes happen in cycles at each level of biological organization?
Practice questions
12 questions · 4 easy · 5 medium · 3 hardQuestion 1
EasyPaper 1A · calculator1 markA potometer is used to measure the rate of water uptake by a leafy shoot, which provides an estimate of the transpiration rate. Which set of environmental conditions would result in the lowest rate of water uptake?
A. High temperature, low humidity, and high wind speed.
B. Low temperature, high humidity, and still air (low wind speed).
C. High temperature, high humidity, and high wind speed.
D. Low temperature, low humidity, and still air (low wind speed).
Consider how each factor (temperature, humidity, wind) affects the rate of evaporation from the leaf surface and the water potential gradient between the leaf and the atmosphere. Which combination of factors minimizes water loss?
Question 2
MediumPaper 2 · calculator15 marksLiving organisms must maintain a stable internal environment, a process known as homeostasis.
(a) Explain the control of blood glucose concentration in humans.
(b) Explain the effect of pH on the activity of enzymes.
(c) Distinguish between the transport of glucose and oxygen in the blood, with reference to the properties of water.
Think about the two key hormones released from the pancreas. What triggers the release of each hormone, what are their target cells, and what is the resulting effect on blood glucose levels?
Consider how pH affects the chemical bonds that maintain a protein's specific three-dimensional shape. What is the term for the irreversible change in an enzyme's structure, and how does this affect its function?
Compare the polarity of glucose and oxygen molecules. How does this property affect how well each substance can dissolve in the main component of blood plasma, which is water?
Question 3
HardPaper 2 · calculator12 marksA study investigated the association between different dietary patterns and blood lipid profiles in a large group of adults. The chart below shows the average composition of dietary fats for a typical Western diet compared to a Mediterranean diet.
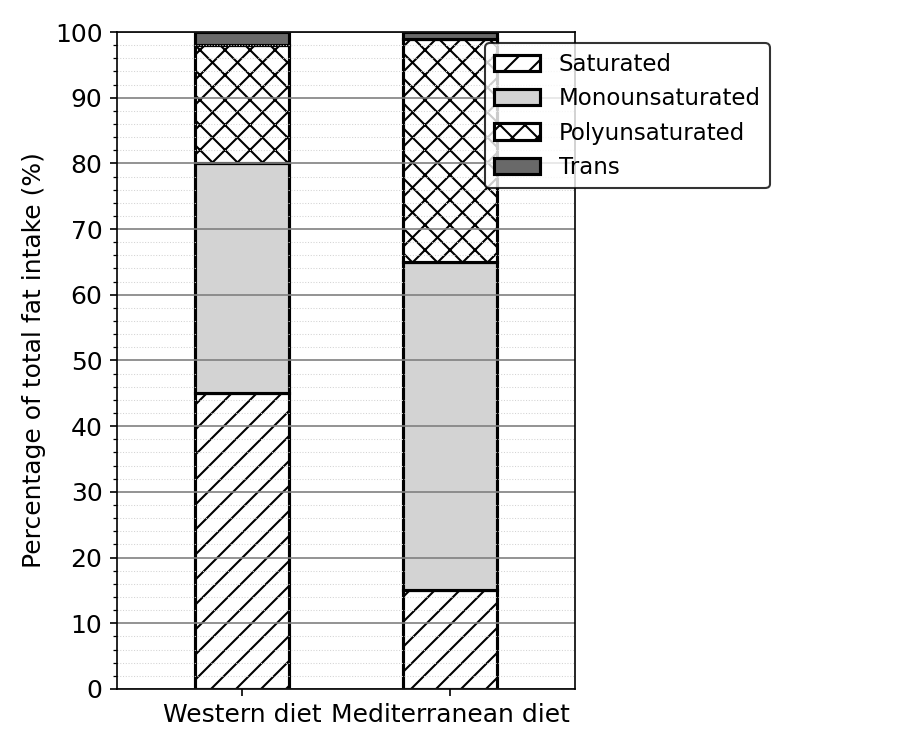
(a) Identify the percentage of fat intake from monounsaturated fats in the Mediterranean diet.
(b) Calculate the difference in the percentage of saturated fat intake between the Western and Mediterranean diets.
(c) Compare and contrast the composition of dietary fats in the Western and Mediterranean diets shown in the chart.
(d) The total daily fat intake was not the same for all participants. Explain why it is not possible to determine from the bar chart which dietary group consumed the greater mass of polyunsaturated fat.
Further data was collected on the relationship between saturated fat intake and blood cholesterol levels. LDL (low-density lipoprotein) is often called 'bad cholesterol' and HDL (high-density lipoprotein) is often called 'good cholesterol'.
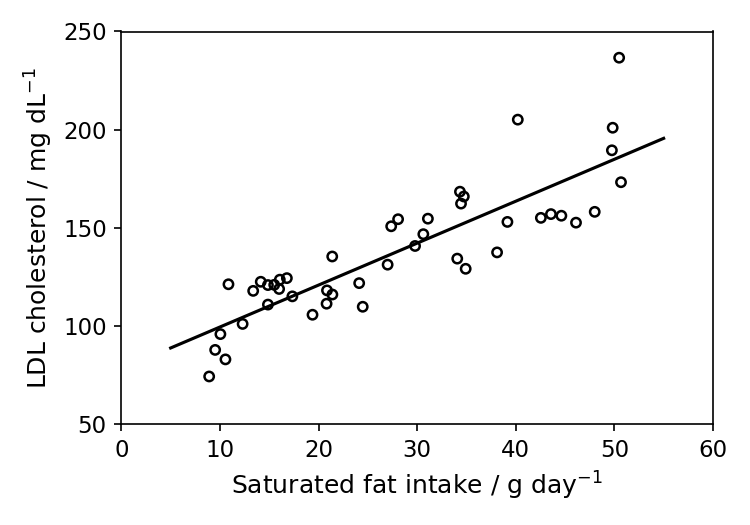
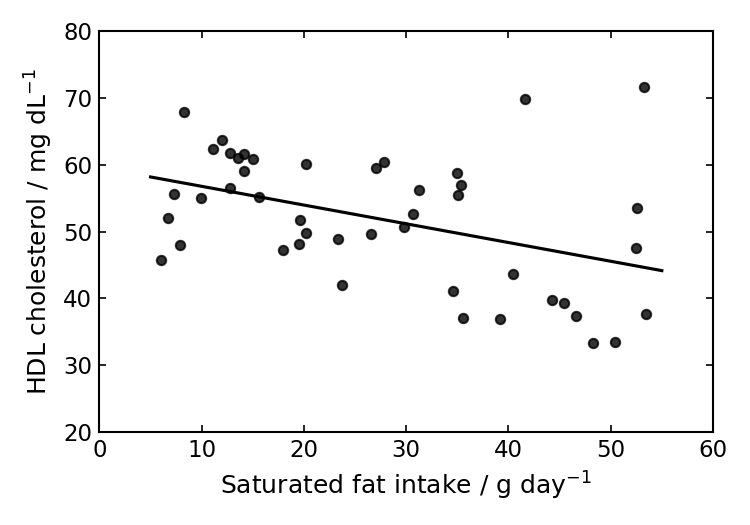
(e) Using the graphs, describe the effect of increasing daily saturated fat intake on LDL and HDL cholesterol levels.
(f) State one harmful effect of high levels of LDL in the blood.
(g) Discuss the evidence from this study that a Mediterranean diet is healthier than a Western diet.
Look at the bar labelled 'Mediterranean diet'. Find the segment corresponding to monounsaturated fats and read its value from the key or labels.
Find the percentage of saturated fat for the Western diet and for the Mediterranean diet. Then, subtract the smaller value from the larger value.
For a 'compare and contrast' question, you need to state at least one similarity and one difference based on the data provided.
Consider what the y-axis of the chart represents. Does it show absolute amounts or proportions?
For each graph, state the trend you observe. Is the relationship positive (as one variable increases, so does the other) or negative (as one increases, the other decreases)?
Think about where excess cholesterol transported by LDL might be deposited in the body and what the consequences are for the circulatory system.
Synthesise the information from all the data provided. Link the dietary composition (bar chart) to the health markers (scatter plots). A good 'discuss' answer considers both points for and against (or limitations of) the evidence.
Question 4
EasyPaper 1A · calculator1 markThe diagram shows a blood capillary passing through muscle tissue.
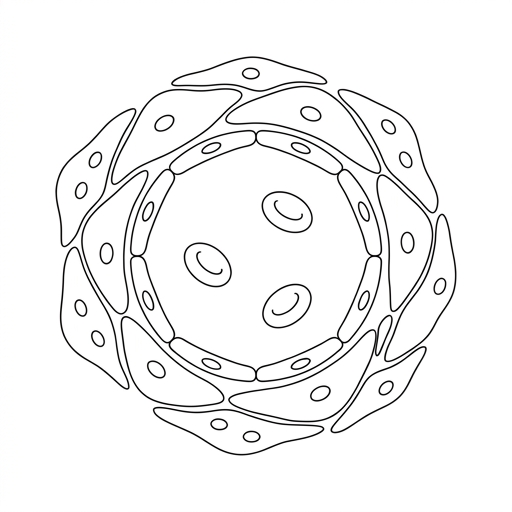
Which feature is the primary adaptation of the capillary for minimizing the diffusion distance to the muscle cells?
A. Extensive branching throughout the tissue
B. A narrow lumen that slows blood flow
C. Walls consisting of a single layer of cells
D. Lack of valves within the vessel
Diffusion is most efficient over short distances. Which structural feature of a capillary wall makes it as short a path as possible for molecules to travel from the blood to the surrounding tissue?
Question 5
MediumPaper 2 · calculator15 marksThe circulatory system transports essential substances, including hormones, which are vital for maintaining a stable internal environment (homeostasis).
(a) Outline how the structures of arteries and capillaries are related to their functions.
(b) Explain the roles of insulin and glucagon in the homeostatic control of blood glucose concentration.
(c) Discuss the causes and treatments for type 2 diabetes.
Think about the pressure of the blood in each vessel type. How does the wall structure and the size of the lumen help the vessel perform its job of either transporting blood under pressure or exchanging materials?
This is a negative feedback loop. Consider what happens when blood sugar is too high and what happens when it is too low. Which hormone is released in each case, where does it come from, and what does it make the target cells do?
Focus on type 2 diabetes specifically. What is the underlying problem with the insulin signalling pathway? How can lifestyle changes and medical interventions help manage this condition?
Question 6
HardPaper 1B · calculator8 marksThe diagram shows pressure changes in the left atrium, left ventricle, and aorta during one cardiac cycle in a healthy adult at rest.
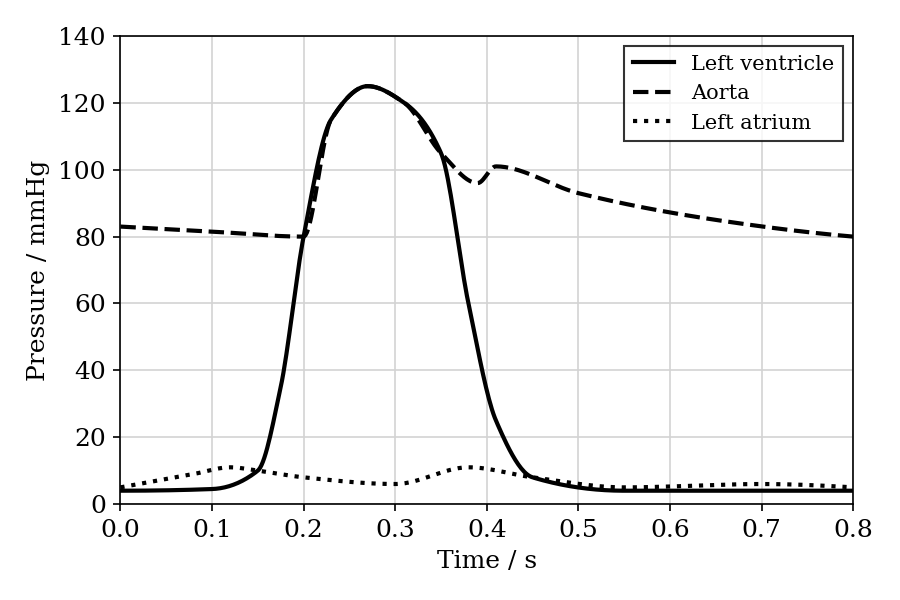
(a) Identify the systolic and diastolic blood pressure of this individual. Include units with your answer.
(b) State the time at which the left ventricle contains the maximum volume of blood.
(c) Explain the pressure changes in the left ventricle between 0.15 s and 0.35 s.
(d) The cardiac output is the volume of blood pumped by the heart per minute. It is calculated by multiplying the heart rate by the stroke volume. Calculate the cardiac output for this individual in L min⁻¹, assuming the stroke volume is 70 ml.
Systolic pressure is the peak pressure in the aorta, while diastolic pressure is the lowest pressure in the aorta. Read these values from the aortic pressure curve on the graph.
The ventricle is fullest just before it begins to contract to pump blood out. This phase is called end-diastole. On the graph, this corresponds to the moment the mitral valve closes and ventricular pressure starts to rise steeply.
This period covers two phases of ventricular systole. First, consider what happens to the pressure when the ventricle contracts but both the mitral and aortic valves are closed. Then, consider what happens once the aortic valve opens.
First, determine the duration of one cardiac cycle from the graph. Use this to calculate the heart rate in beats per minute. Then, use the given formula to find the cardiac output.
Question 7
EasyPaper 1A · calculator1 markWhat is an adaptation of capillaries that facilitates the efficient exchange of substances between blood and tissues?
A. Flexible walls that allow compression by skeletal muscles
B. Narrow diameters that reduce the diffusion distance
C. Elastic tissue that maintains a high blood pressure
D. Valves that prevent the backflow of blood
Consider which blood vessel type is responsible for material exchange and what structural features would make this process most efficient.
Question 8
MediumPaper 1A · calculator1 markWhat is/are the role(s) of hydrogen bonding in the transport of water in the xylem of a plant?
I. It causes cohesion between water molecules, allowing them to be pulled up under tension.
II. It causes adhesion of water molecules to the xylem walls, helping to support the water column against gravity.
III. It generates a high pressure in the roots to push water up the xylem.
A. I only
B. I and II only
C. II and III only
D. I, II and III
Consider the properties of water that arise from its polarity and the formation of hydrogen bonds. How do these properties contribute to the movement of water through the narrow tubes of the xylem?
Question 9
HardPaper 2 · calculator17 marksThe graph shows the changes in blood pressure as blood flows through the human circulatory system from the left ventricle back to the right atrium.
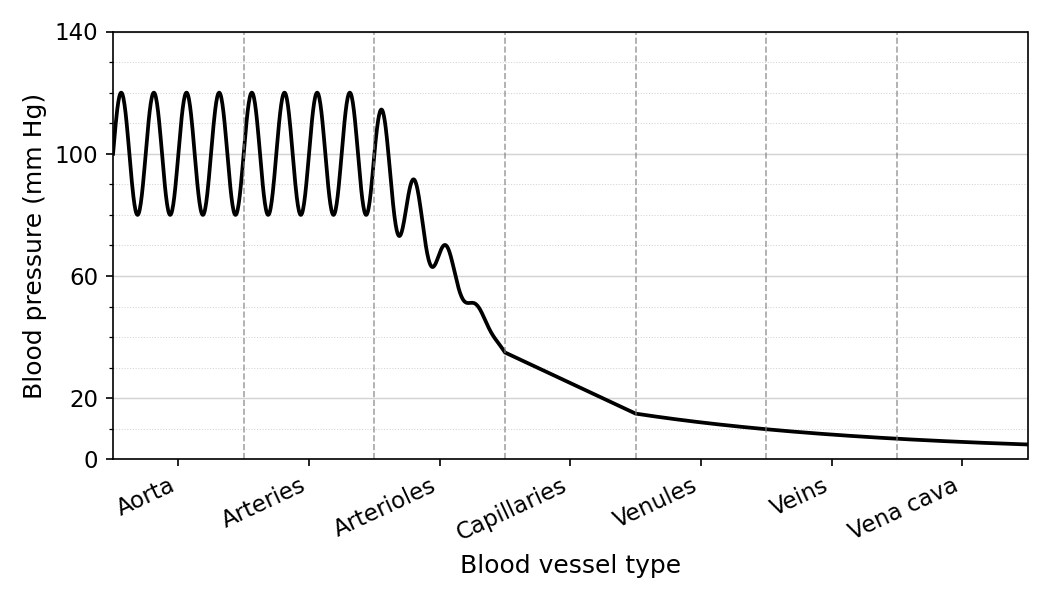
(a) Identify the blood vessel type where the maximum fluctuation in blood pressure occurs.
(b) Calculate the pulse pressure, defined as the difference between the maximum and minimum blood pressure, in the aorta. Include units in your answer.
(c) Explain the cause of the rapid fluctuations in blood pressure observed in the aorta.
(d) Explain how the structure of arteries allows them to withstand and maintain this high blood pressure.
(e) Outline why the blood pressure must be relatively low in the capillaries.
(f) Veins have very low blood pressure. Describe the mechanisms that ensure blood in the veins is returned to the heart.
(g) During exercise, the body requires a higher cardiac output. Explain how the heart rate is controlled by negative feedback to maintain homeostasis during exercise.
Look at the graph to see where the difference between the peaks and troughs is the largest.
Subtract the lowest pressure value from the highest pressure value in the aorta section of the graph.
Think about what the heart is doing to push blood into the aorta and what happens when it rests.
Consider the tissues that make up the artery wall, specifically muscle and elastic fibers, and their mechanical properties.
Think about the structure of a capillary wall and its main function of material exchange.
Since pressure is too low to push blood back, what structures inside veins and outside them help move blood in one direction?
Describe the negative feedback loop: what is the stimulus, where is it detected, what is the control center, and how does the effector (the heart) respond?
Question 10
EasyPaper 1A · calculator1 markWhat are features of capillaries?
| Wall | Diameter | |
|---|---|---|
| A. | one cell thick | narrow |
| B. | thick and muscular | narrow |
| C. | one cell thick | wide |
| D. | thick and muscular | wide |
Consider the function of capillaries in exchanging materials with tissues, which requires a short diffusion distance and the ability to permeate between cells.
Question 11
MediumPaper 2 · calculator10 marksDuring physical activity, the cardiovascular system must rapidly adjust to meet the metabolic demands of skeletal muscles.
(a) Compare and contrast the functions of arteries and veins in the human cardiovascular system.
(b) Distinguish between the structure of the walls of arteries and capillaries.
(c) Outline, with reasons, the correct manual procedure for measuring a patient's pulse rate.
Think about the direction of blood flow relative to the heart, the pressure of the blood they carry, and what they both have in common.
Focus strictly on the layers, thickness, and specific tissues (like muscle or elastic fibers) present in the walls of each vessel type.
Describe where you place your fingers, which fingers you should avoid using and why, and how you calculate the rate per minute.
Question 12
MediumPaper 1A · calculator1 markWhich process generates the pulling force (tension) that drives the transpiration stream in plants?
A. Evaporation of water from the surfaces of mesophyll cells
B. Hydrogen bonding between water molecules in the xylem
C. Active transport of mineral ions into the root xylem
D. Adhesion of water molecules to the lignified xylem walls
Consider which process creates the initial negative pressure at the top of the plant, rather than the properties of water that simply maintain the continuous column.
No question on this page matches those filters. Try another difficulty or paper.
Every Transport question, marked for you
Every answer is marked mark by mark, IB-style, and the AI tutor helps when you are stuck.
Where marks are lost
- Command terms are consistently under-read. Students answer describe when the question said explain, so they give an account with no reasons and cap at half marks. The reverse also happens on outline, where a student writes an essay for a 2-mark summary and runs out of time.
- compare and contrast answers give only similarities, or only differences.
