Climate Change: notes and practice questions
- This topic explores the anthropogenic drivers and ecological impacts of climate change on ecosystems.
- Anthropogenic causes include increased atmospheric concentrations of carbon dioxide and methane.
- Positive feedback cycles in global warming involve processes like carbon dioxide release from oceans and melting permafrost.
- Climate change can lead to tipping points, such as boreal forests shifting from carbon accumulation to net loss.
- Impacts include melting landfast and sea ice, affecting polar habitats like those of emperor penguins and walruses.
- Changes in ocean currents can alter nutrient upwelling, decreasing marine primary production.
- Species exhibit poleward and upslope range shifts in response to changing climates.
- Threats to coral reefs include ocean acidification and coral bleaching, potentially leading to ecosystem collapse.
How it is examined
Positive feedback questions want the loop closed: warming causes X, X causes more warming. An answer that lists effects without showing the loop scores as description, not explanation. Coral reef questions separate acidification from bleaching, and students routinely blame both on temperature. At HL, phenological mismatch answers need two populations responding to different cues, which is the whole point of the great tit and caterpillar example.
- D4.3.1 Anthropogenic causes of climate change, limited to anthropogenic increases in atmospheric concentrations of carbon dioxide and methane.
- D4.3.2 Positive feedback cycles in global warming: release of carbon dioxide from deep ocean, increases in absorption of solar radiation due to loss of reflective snow and ice, accelerating rates of decomposition of peat and previously undecomposed organic matter in permafrost, release of methane from melting permafrost, and increases in droughts and forest fires.
- D4.3.3 Change from net carbon accumulation to net loss in boreal forests as an example of a tipping point. Warmer temperatures and decreased winter snowfall lead to increased drought and reduced primary production in taiga, with forest browning and increases in the frequency and intensity of forest fires, resulting in legacy carbon combustion.
- D4.3.4 Melting of landfast ice and sea ice as examples of polar habitat change. The named cases are potential loss of breeding grounds of the emperor penguin (Aptenodytes forsteri) due to early breakout of landfast ice in the Antarctic, and loss of sea ice habitat for walruses in the Arctic.
Causes are limited to anthropogenic increases in carbon dioxide and methane. Nitrous oxide, CFCs, solar cycles and Milankovitch cycles are all outside the syllabus here.
- D4.3.9 Phenology as research into the timing of biological events. Photoperiod and temperature patterns are examples of variables influencing the timing of flowering, budburst and bud set in deciduous trees, bird migration and nesting.
- D4.3.10 Disruption to the synchrony of phenological events by climate change. Within an ecosystem, temperature may be the cue in one population and photoperiod the cue in another. Required examples: spring growth of the Arctic mouse-ear chickweed (Cerastium arcticum) and arrival of migrating reindeer (Rangifer tarandus), plus a suitable local example or the breeding of the great tit (Parus major) and peak biomass of caterpillars in north European forests.
- D4.3.11 Increases to the number of insect life cycles within a year due to climate change, using the spruce bark beetle (Ips typographus or Dendroctonus micans) as the example.
- D4.3.12 Evolution as a consequence of climate change, including changes in the fitness of colour variants of the tawny owl (Strix aluco) as a consequence of changes in snow cover.
Guiding questions
- What are the drivers of climate change?
- What are the impacts of climate change on ecosystems?
Linking questions
- What are the impacts of climate change at each level of biological organization?
- What processes determine the distribution of organisms on Earth?
Practice questions
14 questions · 10 medium · 4 hardQuestion 1
MediumPaper 1A · calculator1 markA positive feedback loop in the context of climate change is a cycle where an initial change is amplified. Which of the following is an example of a positive feedback loop accelerating global warming?
A. Melting of permafrost releases trapped methane, a potent greenhouse gas, which causes further warming.
B. Increased atmospheric CO₂ stimulates plant growth, leading to greater carbon sequestration in forests.
C. Warmer air holds more water vapour, leading to increased cloud cover that reflects solar radiation.
D. Higher global temperatures cause the expansion of deserts, reducing the land available for agriculture.
A positive feedback loop is a cycle where the effect reinforces the original cause. Look for an option where a consequence of warming leads to even more warming.
Question 2
HardPaper 2 · calculator15 marks(a) Outline the processes that generate genetic variation within a population.
(b) Explain how natural selection acts on this variation to cause evolutionary change.
(c) Discuss how anthropogenic climate change affects the distribution and survival of species in polar habitats, including the emperor penguin.
Think about the original source of new traits and how cell division and reproduction mix these traits.
Consider what happens when a population produces too many offspring, and how advantageous traits affect survival and reproduction.
Include the causes of climate change, its physical effects on polar ice, and specific examples of how this impacts named species like the emperor penguin or walrus.
Question 3
MediumPaper 2 · calculator10 marksThe Mesoamerican Barrier Reef is experiencing significant environmental changes due to anthropogenic activities.
Global warming leads to the melting of landfast ice and thermal expansion of oceans. Explain how the resulting sea level rise threatens the survival of coral reefs.
(b) As atmospheric carbon dioxide concentrations increase, more dissolves in the oceans. Explain how this process affects the ability of corals to build their skeletons.
(c) Describe the phenomenon of coral bleaching that occurs when ocean temperatures exceed the normal range of tolerance for corals.
(d) Deforestation on nearby land can lead to soil erosion and increased turbidity in coastal waters. Explain why this turbidity is a threat to coral reefs.
Think about what happens to the water depth above the coral and how that affects the physical conditions they need to survive.
Consider the chemical changes in the ocean water when carbon dioxide dissolves, and what corals use to build their hard structures.
What do corals lose when they are stressed by high temperatures, and what is the visual result?
Turbidity means the water is cloudy with suspended particles. How does this affect the light reaching the reef?
Question 4
HardPaper 2 · calculator10 marks(a) The graph shows the Keeling Curve, which records the atmospheric carbon dioxide concentration measured at the Mauna Loa Observatory in Hawaii from 1960 to 2020.
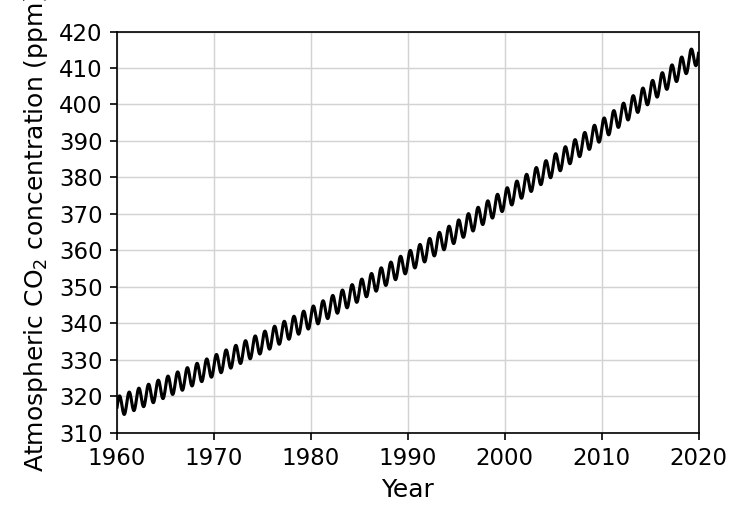
Explain the annual fluctuations in atmospheric carbon dioxide concentration shown in the graph.
(b) Describe the long-term trends in atmospheric carbon dioxide concentration shown in the graph.
(c) Outline the anthropogenic causes of the increase in atmospheric carbon dioxide and methane.
(d) Discuss how positive feedback cycles could lead to a tipping point in the Earth's climate system.
Think about how the seasons affect the rate of photosynthesis in the Northern Hemisphere.
Look at the overall direction of the curve from 1960 to 2020 and whether the slope is constant.
Identify human activities that release these two specific greenhouse gases into the atmosphere.
Define what a tipping point is and provide an example of a cycle that amplifies warming, such as melting permafrost.
Question 5
MediumPaper 2 · calculator5 marks(a) Explain why rapid climate change is a major driver of the current biodiversity crisis.
Think about the speed of environmental changes compared to how quickly species can adapt, evolve, or move, and the ultimate consequence for species survival.
Question 6
HardPaper 2 · calculator15 marks(a) Outline how human activities can destabilize ecosystems by causing biodiversity loss.
(b) Describe how positive feedback loops accelerate global warming and how this impacts polar habitats.
(c) Explain how anthropogenic climate change threatens the stability of coral reef ecosystems.
Think about the main anthropogenic causes of extinction and how the loss of species affects the overall ecosystem.
A positive feedback loop amplifies an initial change. Consider what happens when ice melts or permafrost thaws, and how the loss of ice affects specific polar animals.
Discuss the causes of climate change and the two main threats it poses to coral reefs: rising temperatures and changes in ocean chemistry.
Question 7
MediumPaper 2 · calculator5 marksExplain how predicted changes in the global climate and atmospheric composition could affect future rates of photosynthesis in terrestrial ecosystems.
Consider the main factors that limit the rate of photosynthesis and how climate change (such as rising temperatures and greenhouse gases) will alter them.
Question 8
HardPaper 2 · calculator15 marksAnthropogenic climate change is having profound impacts on ecosystems globally.
(a) Outline the threats to coral reefs from anthropogenic climate change.
(b) Describe the impacts of climate change on polar habitats and the species that depend on them.
(c) Explain how carbon is cycled in ecosystems and how anthropogenic climate change is altering this cycle.
Think about both the temperature of the water and the chemical changes caused by dissolved carbon dioxide.
Consider the physical changes to the ice and how this affects specific named animals, as well as broader ecosystem effects like ocean currents.
Start by describing the biological processes that move carbon between the atmosphere and living organisms, then explain how human activities disrupt this balance and create feedback loops.
Question 9
MediumPaper 1B · calculator10 marksThe graph shows the Keeling Curve, which records atmospheric carbon dioxide () concentrations at the Mauna Loa Observatory from 2010 to 2014.
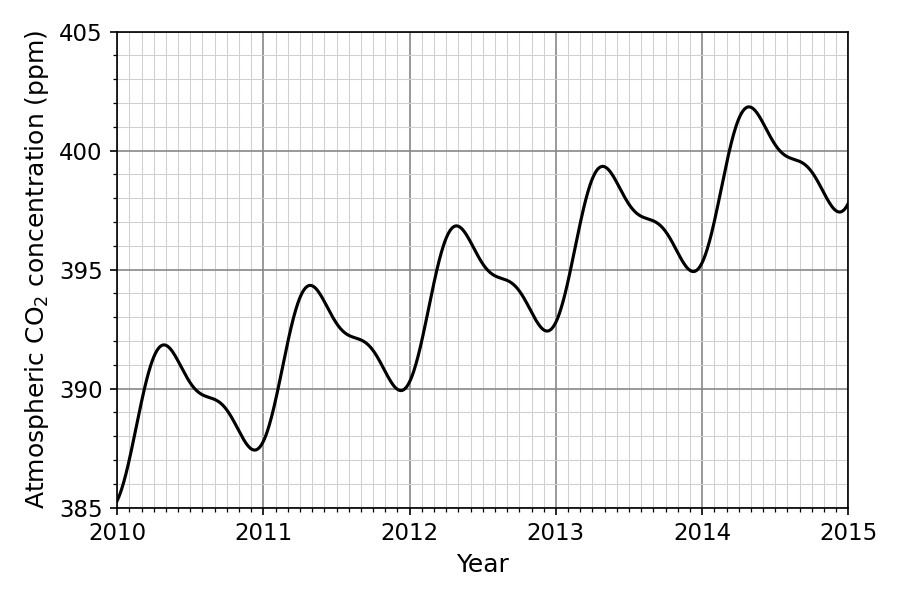
Estimate the seasonal variation in concentration within a single year.
Explain the biological processes responsible for the annual fluctuations in concentration.
Calculate the mean annual increase in concentration between May 2010 and May 2014.
Assuming the mean annual increase remains constant, predict the peak concentration in May 2030.
Outline two anthropogenic activities that contribute to the long-term upward trend in the Keeling Curve.
Look at the difference between the highest point (peak) and the lowest point (trough) of the curve within any single year on the graph.
Think about which biological process removes carbon dioxide from the air and which process adds it, and how the rates of these processes vary with the seasons in the Northern Hemisphere.
Find the concentration at the peak in 2010 and the corresponding peak in 2014, calculate the total difference, and divide by the number of years.
Determine how many years it is from 2014 to 2030, multiply that by your annual increase from (c)(i), and add it to the 2014 peak value.
What human activities release large amounts of carbon dioxide or reduce the Earth's ability to absorb it?
Question 10
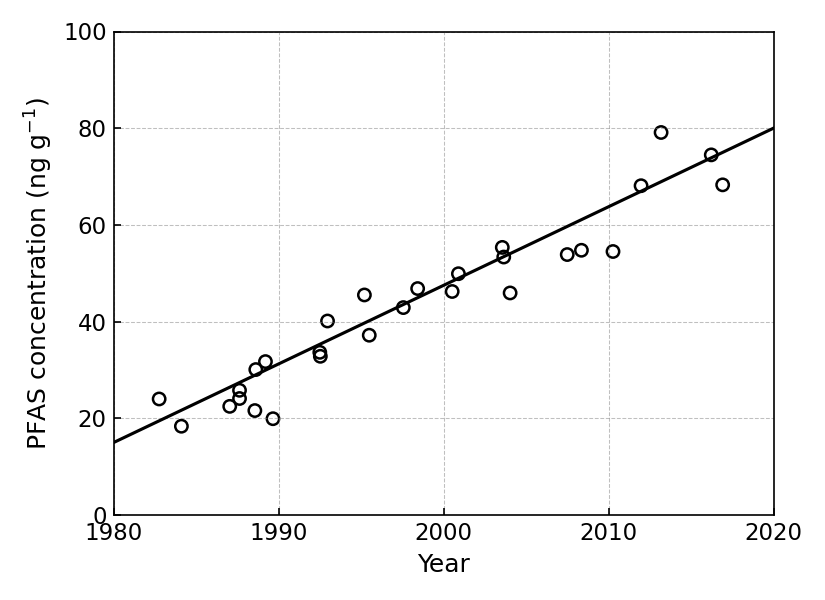
MediumPaper 2 · calculator10 marksThe graph shows the concentrations of PFAS (per- and polyfluoroalkyl substances), a group of synthetic chemicals, in blood samples from emperor penguins (Aptenodytes forsteri) in Antarctica.
Explain how PFAS can become more concentrated in the blood of emperor penguins than in the surrounding Antarctic seawater.
(b.i) Outline the trend shown in the graph.
(b.ii) Suggest reasons for the trend.
(c) Outline one other anthropogenic threat to emperor penguin populations.
Think about how chemicals move through a food chain and what happens if they cannot be broken down or excreted by the body.
Look at the overall direction of the line of best fit and use data from the axes to describe the change.
Where do synthetic chemicals come from, and how might they reach an isolated environment like Antarctica?
Consider the specific habitat requirements of emperor penguins and how human-induced climate change affects this.
Question 11
MediumPaper 2 · calculator7 marks(a) Explain the anthropogenic causes of climate change and the biological strategies that can be used to mitigate it.
Think about which specific gases are responsible for the greenhouse effect, where they come from, and how processes like photosynthesis and ecosystem restoration can remove them from the atmosphere.
Question 12
MediumPaper 1A · calculator1 markWhich process acts as a positive feedback cycle in global warming?
A. The release of carbon dioxide from warming ocean waters
B. The increased rate of photosynthesis due to higher carbon dioxide concentrations
C. The expansion of afforestation and wetland restoration projects
D. The poleward range shift of bird and insect species
A positive feedback cycle amplifies the initial change. Look for a process where an increase in temperature causes an effect that leads to even more warming.
Question 13
MediumPaper 1A · calculator1 markWhich process is a positive feedback cycle that accelerates global warming?
A. Increased atmospheric concentration increases the rate of photosynthesis in plants.
B. Melting of permafrost releases trapped methane into the atmosphere.
C. Rising global temperatures cause species to shift their geographic ranges towards the poles.
D. Increased evaporation from oceans leads to more low cloud cover, reflecting solar radiation.
A positive feedback cycle in climate change is a process where the effects of warming cause further warming. Look for an option that adds more greenhouse gases to the atmosphere.
Question 14
MediumPaper 1A · calculator1 markWhich statement correctly describes an impact of climate change on ecosystems or the Earth system?
A. Boreal forests shift from being a net source of carbon to a net sink of carbon.
B. Melting of landfast ice increases the available breeding habitat for emperor penguins.
C. Changes in ocean currents decrease nutrient upwelling, reducing marine primary production.
D. Thawing of permafrost absorbs methane from the atmosphere, slowing global warming.
Consider whether each process acts as a positive or negative feedback loop, and recall the specific habitat requirements of polar species.
No question on this page matches those filters. Try another difficulty or paper.
Every Climate Change question, marked for you
Every answer is marked mark by mark, IB-style, and the AI tutor helps when you are stuck.
Where marks are lost
- Command terms are consistently under-read. Students answer describe when the question said explain, so they give an account with no reasons and cap at half marks. The reverse also happens on outline, where a student writes an essay for a 2-mark summary and runs out of time.
