Transfer of Energy and Matter: notes and practice questions
- This topic explores the transfer of energy and the recycling of matter within ecosystems.
- Ecosystems are open systems, allowing both energy and matter to enter and exit.
- Sunlight is the principal energy source for most ecosystems, supporting autotrophs.
- Chemical energy flows through food chains, with arrows indicating the direction of transfer.
- Energy is lost as heat at each successive trophic level, limiting food chain length.
- Matter, including carbon and other chemical elements, is recycled within ecosystems by decomposers.
- Primary production is the accumulation of carbon compounds in biomass by autotrophs, measured in g m yr.
- The carbon cycle illustrates processes like photosynthesis, respiration, feeding, and combustion.
- The Keeling Curve shows annual fluctuations and long-term trends in atmospheric carbon dioxide.
How it is examined
Keeling Curve analysis is a set piece: the annual sawtooth from northern hemisphere photosynthesis in summer, and the long-term rise from combustion. A student who explains only one of the two scores half. Energy transfer efficiency calculations appear in Paper 1B with a percentage answer expected. Food web questions ask deduce the effect of removing one species, and the mark is for the knock-on effect through at least two trophic levels.
- C4.2.1 Ecosystems as open systems in which both energy and matter can enter and exit. In closed systems only energy passes in and out.
- C4.2.2 Sunlight as the principal source of energy that sustains most ecosystems, including exceptions such as ecosystems in caves and below the levels of light penetration in oceans. NOS: laws in science are generalized principles describing patterns observed in nature; unlike theories they do not explain, but like theories they can predict.
- C4.2.3 Flow of chemical energy through food chains. Chemical energy passes to a consumer as it feeds on an organism at the previous stage.
- C4.2.4 Construction of food chains and food webs to represent feeding relationships in a community, in a local community if possible. Arrows indicate the direction of transfer of energy and biomass.
Guiding questions
- What is the reason matter can be recycled in ecosystems but energy cannot?
- How is the energy that is lost by each group of organisms in an ecosystem replaced?
Linking questions
- What are the direct and indirect consequences of rising carbon dioxide levels in the atmosphere?
- How does the transformation of energy from one form to another make biological processes possible?
Practice questions
10 questions · 2 easy · 6 medium · 2 hardQuestion 1
EasyPaper 1A · calculator1 markIn the marine food chain shown, what is the trophic level of the small fish and what is its mode of feeding?
Phytoplankton → Zooplankton → Small fish → Tuna
| Trophic level | Mode of feeding | |
|---|---|---|
| A. | 2 | Primary consumer |
| B. | 3 | Autotroph |
| C. | 4 | Tertiary consumer |
| D. | 3 | Secondary consumer |
The first organism in a food chain, the producer, is at trophic level 1. Count the number of steps from the producer to the small fish to determine its trophic level. Then, identify its feeding role based on what it consumes.
Question 2
MediumPaper 1A · calculator1 markWhich statement correctly describes the flow of energy in a food chain?
A. Energy flows from consumers to producers.
B. Approximately 90% of energy is transferred from one trophic level to the next.
C. Energy is lost as heat at each trophic level.
D. The energy from sunlight is directly used by all organisms in the food chain.
Consider the source of energy for most ecosystems and the efficiency of energy transfer between organisms. Think about metabolic processes and what they release.
Question 3
HardPaper 2 · calculator10 marks(a) The graph shows the Keeling Curve, which records the atmospheric carbon dioxide concentration measured at the Mauna Loa Observatory in Hawaii from 1960 to 2020.
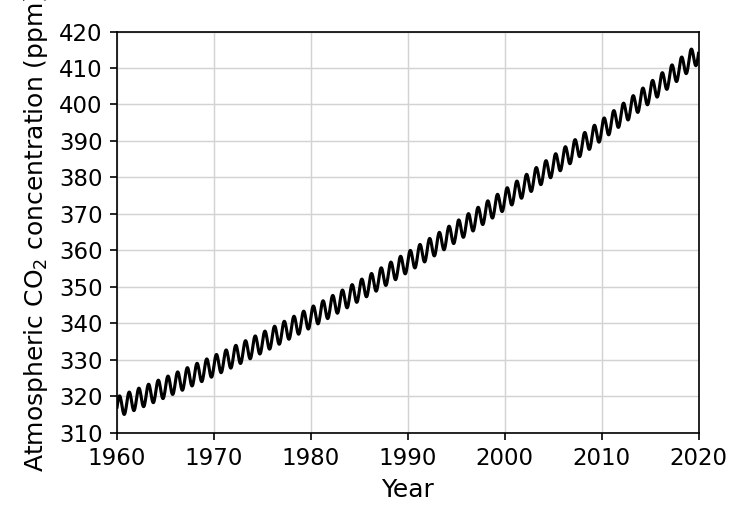
Explain the annual fluctuations in atmospheric carbon dioxide concentration shown in the graph.
(b) Describe the long-term trends in atmospheric carbon dioxide concentration shown in the graph.
(c) Outline the anthropogenic causes of the increase in atmospheric carbon dioxide and methane.
(d) Discuss how positive feedback cycles could lead to a tipping point in the Earth's climate system.
Think about how the seasons affect the rate of photosynthesis in the Northern Hemisphere.
Look at the overall direction of the curve from 1960 to 2020 and whether the slope is constant.
Identify human activities that release these two specific greenhouse gases into the atmosphere.
Define what a tipping point is and provide an example of a cycle that amplifies warming, such as melting permafrost.
Question 4
EasyPaper 2 · calculator5 marks(a) State the biological term for all the interacting organisms in an ecosystem.
(b) State the biological term for the splitting of a pre-existing species into two or more new species.
(c) State the biological term for a group of organisms that have evolved from a common ancestor.
(d) State the biological term for the accumulation of carbon compounds in biomass by autotrophs.
(e) State the biological term for the maximum population size an environment can sustain.
Think about the level of ecological organization that includes multiple different species living together, but does not include the abiotic factors.
What is the evolutionary process that increases biodiversity by creating new distinct lineages?
This term is used in phylogenetic classification to describe a complete branch on an evolutionary tree.
This represents the energy captured by plants that is converted into organic matter.
This limit is determined by the availability of resources such as food, water, and space in the environment.
Question 5
MediumPaper 1A · calculator1 markThe diagram shows energy flows that contribute to the greenhouse effect. Which arrow represents the radiation that is primarily absorbed by greenhouse gases?
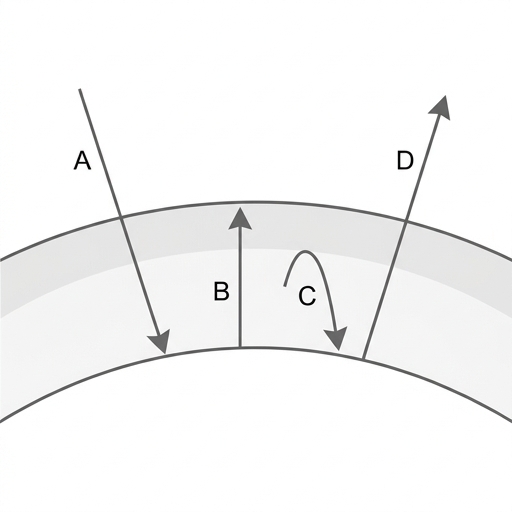
A. A
B. B
C. C
D. D
Greenhouse gases in the atmosphere do not interact with all types of radiation equally. Consider what kind of energy the Earth radiates after being warmed by the sun, and how this energy interacts with gases like .
Question 6
HardPaper 2 · calculator15 marksAnthropogenic climate change is having profound impacts on ecosystems globally.
(a) Outline the threats to coral reefs from anthropogenic climate change.
(b) Describe the impacts of climate change on polar habitats and the species that depend on them.
(c) Explain how carbon is cycled in ecosystems and how anthropogenic climate change is altering this cycle.
Think about both the temperature of the water and the chemical changes caused by dissolved carbon dioxide.
Consider the physical changes to the ice and how this affects specific named animals, as well as broader ecosystem effects like ocean currents.
Start by describing the biological processes that move carbon between the atmosphere and living organisms, then explain how human activities disrupt this balance and create feedback loops.
Question 7
MediumPaper 1B · calculator10 marksThe graph shows the Keeling Curve, which records atmospheric carbon dioxide () concentrations at the Mauna Loa Observatory from 2010 to 2014.
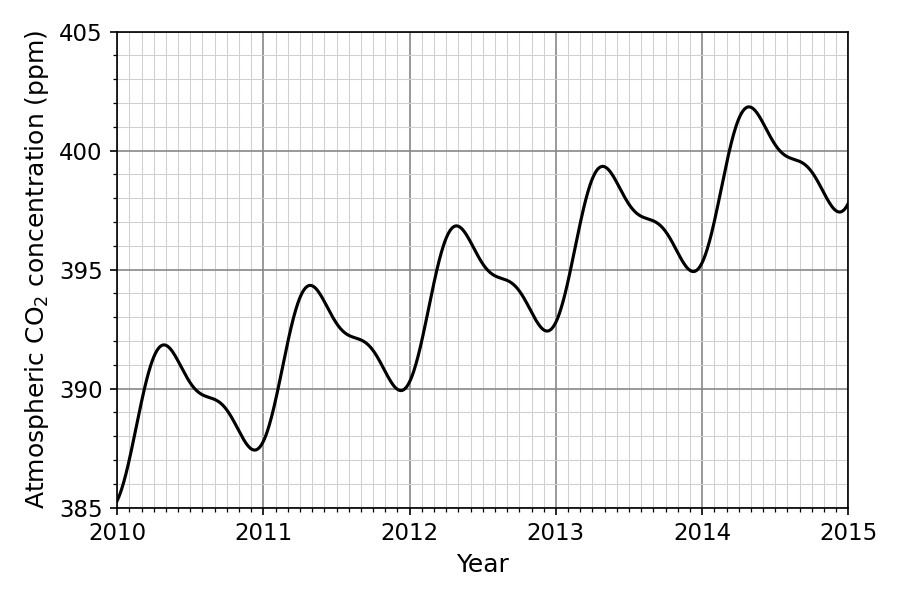
Estimate the seasonal variation in concentration within a single year.
Explain the biological processes responsible for the annual fluctuations in concentration.
Calculate the mean annual increase in concentration between May 2010 and May 2014.
Assuming the mean annual increase remains constant, predict the peak concentration in May 2030.
Outline two anthropogenic activities that contribute to the long-term upward trend in the Keeling Curve.
Look at the difference between the highest point (peak) and the lowest point (trough) of the curve within any single year on the graph.
Think about which biological process removes carbon dioxide from the air and which process adds it, and how the rates of these processes vary with the seasons in the Northern Hemisphere.
Find the concentration at the peak in 2010 and the corresponding peak in 2014, calculate the total difference, and divide by the number of years.
Determine how many years it is from 2014 to 2030, multiply that by your annual increase from (c)(i), and add it to the 2014 peak value.
What human activities release large amounts of carbon dioxide or reduce the Earth's ability to absorb it?
Question 8
MediumPaper 2 · calculator10 marks(a) A freshwater lake is an example of an open ecosystem. Suggest processes that demonstrate that both energy and matter flow into and out of this lake.
(b) Explain why carbon can be continuously cycled within the lake ecosystem, whereas energy cannot.
(c) The lake supports a food chain consisting of phytoplankton, zooplankton, small fish, and osprey (a bird of prey). Outline the reasons why this food chain is unlikely to support another trophic level above the osprey.
Think about what forms of energy enter and leave a biological community, and how physical substances might cross the boundaries of a lake.
Consider the laws of thermodynamics: what happens to energy when it is converted from one form to another, and can organisms reuse heat?
Think about the proportion of energy transferred between trophic levels and what this means for the total energy available at the top of the food chain.
Question 9
MediumPaper 2 · calculator10 marksThe graph shows the concentrations of PFAS (per- and polyfluoroalkyl substances), a group of synthetic chemicals, in blood samples from emperor penguins (Aptenodytes forsteri) in Antarctica.
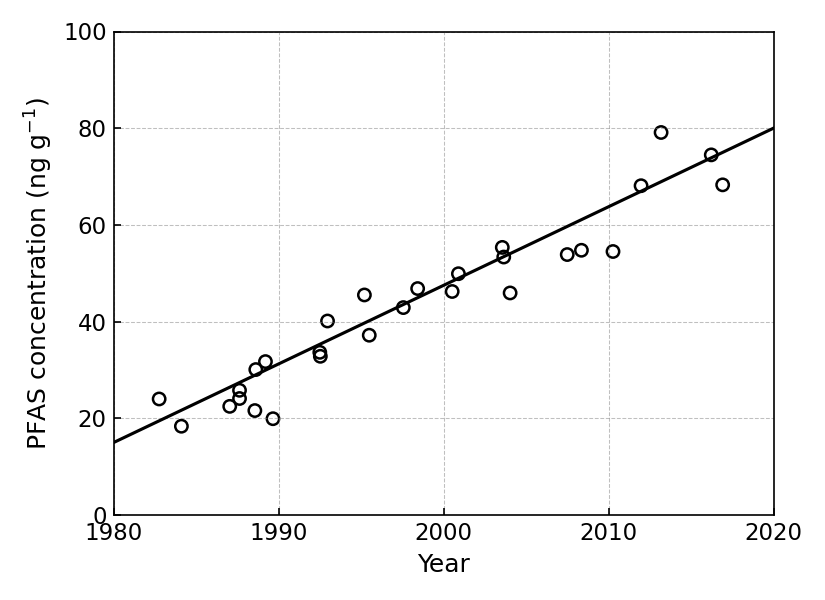
Explain how PFAS can become more concentrated in the blood of emperor penguins than in the surrounding Antarctic seawater.
(b.i) Outline the trend shown in the graph.
(b.ii) Suggest reasons for the trend.
(c) Outline one other anthropogenic threat to emperor penguin populations.
Think about how chemicals move through a food chain and what happens if they cannot be broken down or excreted by the body.
Look at the overall direction of the line of best fit and use data from the axes to describe the change.
Where do synthetic chemicals come from, and how might they reach an isolated environment like Antarctica?
Consider the specific habitat requirements of emperor penguins and how human-induced climate change affects this.
Question 10
MediumPaper 1A · calculator1 markAn influx of agricultural fertilizer into a lake causes a rapid increase in the population of algae. Following the death of the algae, the dissolved oxygen concentration in the lake drops significantly.
Which process is directly responsible for this decrease in oxygen?
A. Aerobic respiration by saprotrophic bacteria
B. Cessation of photosynthesis by the dead algae
C. Anaerobic respiration by decomposers
D. Aerobic respiration by primary consumers
Consider what happens to the organic matter of the algae after they die and which organisms are responsible for breaking it down.
No question on this page matches those filters. Try another difficulty or paper.
Every Transfer of Energy and Matter question, marked for you
Every answer is marked mark by mark, IB-style, and the AI tutor helps when you are stuck.
Where marks are lost
- Command terms are consistently under-read. Students answer describe when the question said explain, so they give an account with no reasons and cap at half marks. The reverse also happens on outline, where a student writes an essay for a 2-mark summary and runs out of time.
