Straight line (gradient-int, general, point gradient form): notes and practice questions
- Gradient measures slope: for points and .
- Gradient-intercept form: , where is gradient and is y-intercept.
- Point-gradient form: , requires gradient and a point .
- General form: , where are usually integers.
- x-intercept:
- y-intercept:
- Parallel lines have identical gradients: .
- Perpendicular lines have gradients whose product is -1: .
- Note: Horizontal () and vertical () lines are perpendicular.
- To find an equation from two points: calculate gradient, use point-gradient form, then rearrange.
- For general form, clear fractions by multiplying by denominators.
- Use GDC statistics mode () to check linear regression.
- Graph equations on GDC to visually verify.
- To compare lines (parallel/perpendicular), rearrange both to to find gradients.
How it is examined
Underpins a large slice of the course rather than standing alone: perpendicular bisectors (SL 3.5) and Voronoi diagrams (SL 3.6) are straight-line work in disguise, and so is every regression line in topic 4. Questions that do target it directly are short and often ask for general form, which students who have only practised get wrong by leaving fractions in place.
The three forms of a straight line, and the parallel and perpendicular conditions.
- Different forms of the equation of a straight line.
- Gradient and intercepts.
- Lines with gradients and .
- Parallel lines, .
Linking questions
- Other contexts: gradients of mountain roads, gradients of access ramps.
- Links to other subjects: exchange rates, price and income elasticity, demand and supply curves (economics); graphical analysis in experimental work (sciences).
- TOK: Descartes showed that geometric problems could be solved algebraically and vice versa. What does that tell us about mathematical representation and mathematical knowledge?
Practice questions
62 questions · 1 easy · 52 medium · 9 hardQuestion 1
EasyPaper 1 · calculator5 marksConsider the line to be a normal to the graph of at the point Consider the line to be the tangent to the graph of at point D.
Find the gradient of .
Find the equation of , giving the answer in the form , where , and .
The tangent and the normal lines are perpendicular to each other.
Try finding the equation of the straight line in the slope intercept form then change it to required form.
Question 2
MediumPaper 1 · calculator7 marksConsider the function , .
Find .
Find the coordinates of the point at which the normal has a gradient of
When is moved from the denominator to the numerator, the sign of its power flips.
Remember that the derivative equation gives the tangent line gradient and that the normal and tangent lines are perpendicular.
Question 3
HardPaper 1 · calculator9 marksThree emergency service hubs are located at coordinates F1 (2, 5), P1 (10, 5), and H1 (10, 15), where distances are measured in kilometers. A central dispatch unit needs to be built at a location equidistant from these three hubs. This location is a vertex of the Voronoi diagram formed by the hubs.
Write down the coordinates of this central dispatch unit.
Find the equation of the perpendicular bisector of the segment connecting F1 (2, 5) and H1 (10, 15).
A new emergency hub, S1 (4, 8), is established, and the Voronoi diagram is redrawn. Several potential locations for a new drone charging station are at the vertices of this updated diagram. The coordinates of four such vertices are given as V_alpha (6, 10), V_beta (6, 4.5), V_gamma (8.75, 10), and V_delta (, ). The drone charging station should be built at the vertex that is as far as possible from its nearest emergency service hub.
By calculating appropriate distances, find the location of the drone charging station.
Hence, write down the distance of the drone charging station to the nearest emergency service hub.
The central dispatch unit is the circumcenter of the triangle formed by F1, P1, and H1. Consider the perpendicular bisectors of the segments connecting the hubs.
First, find the midpoint of the segment [F1H1]. Then, calculate the gradient of [F1H1] and its negative reciprocal to find the gradient of the perpendicular bisector. Finally, use the point-gradient form of a straight line.
For each given vertex, calculate its distance to all four hubs (F1, P1, H1, S1). Identify the shortest distance for each vertex. Then, choose the vertex for which this shortest distance is the largest.
Refer to your calculations in part (c.i) for the maximum of the minimum distances.
Question 4
MediumPaper 1 · calculator6 marksConsider the function .
(a) Find .
(b) Find how many points of inflection does this function contain.
To find the point of inflection you need to set the second derivative equal to zero and calculate at which value this happens.
Points of inflection are the points at which the second derivative of a function is equal to zero.
Question 5
HardPaper 2 · calculator13 marksA company is designing an open-top storage container with a square base. The side length of the base is cm and the height is cm. The container needs to have a volume of cm.
Explain why .
Rearrange the equation in part (a) to make the subject.
Write down an expression for the surface area, , of the open-top container.
Show that this can be written as
Plot the graph of for .
Find the minimum surface area and the value of when this occurs.
Recall the formula for the volume of a rectangular prism (or cuboid). The base is a square.
Isolate the variable on one side of the equation.
The container has a square base and four rectangular sides. Remember it is open-top.
Substitute the expression for from part (b) into the surface area formula from part (c).
Use your GDC to plot the function. Ensure you choose an appropriate window to see the minimum point.
You can use the GDC's 'minimum' function or calculus by finding the derivative and setting it to zero.
Question 6
MediumPaper 1 · calculator6 marksConsider the function .
Find .
Find how many points of inflection does this function contain.
To find the point of inflection you need to set the second derivative equal to zero and calculate at which value this happens.
Points of inflection are the points at which the second derivative of a function is equal to zero.
Question 7
HardPaper 2 · calculator14 marks(a) An architect is designing a decorative archway for a park entrance. The cross-section of one half of the archway is modeled. The archway is symmetrical about the y-axis.
The architect models the base section of the archway as a straight line passing through the points and , where all units are in metres.
Find the equation of the line passing through these two points.
(b) The architect initially models the curved upper section of the archway using the following measured points:
, , , and .
(i) Find the equation of the least squares regression quadratic curve for these four points.
(ii) By considering the gradient of this curve when , explain why it may not be a good model for the archway.
(c) The architect decides that a better model for the curved section would be a quadratic curve with a maximum point at and that passes through the endpoint .
Find the equation of this new quadratic model.
(d) Believing this to be a better model for the archway, the architect wants to estimate the volume of the solid generated by rotating this half-archway about the x-axis.
(i) Write down an expression for this estimate of the volume as a sum of two integrals.
(ii) Find the value of this estimate.
Recall the formula for the gradient of a straight line given two points, and then use the point-slope form or slope-intercept form to find the equation of the line.
Use a graphing display calculator (GDC) to perform a quadratic regression on the given data points. Ensure your calculator is set to the appropriate regression type.
Calculate the gradient of the straight line from part (a) at and the gradient of the quadratic curve from part (b.i) at . Compare these values to assess the smoothness of the transition.
Use the vertex form of a quadratic equation, , where is the maximum point. Substitute the maximum point and the given endpoint to solve for the constant .
The volume of revolution about the x-axis is given by . You need to set up two integrals, one for the straight line segment and one for the quadratic curve, with their respective limits.
Evaluate the integrals from part (d.i) using your GDC. Remember to multiply by .
Question 8
MediumPaper 1 · calculator5 marksThe diagram shows the slope field for the differential equation for and .
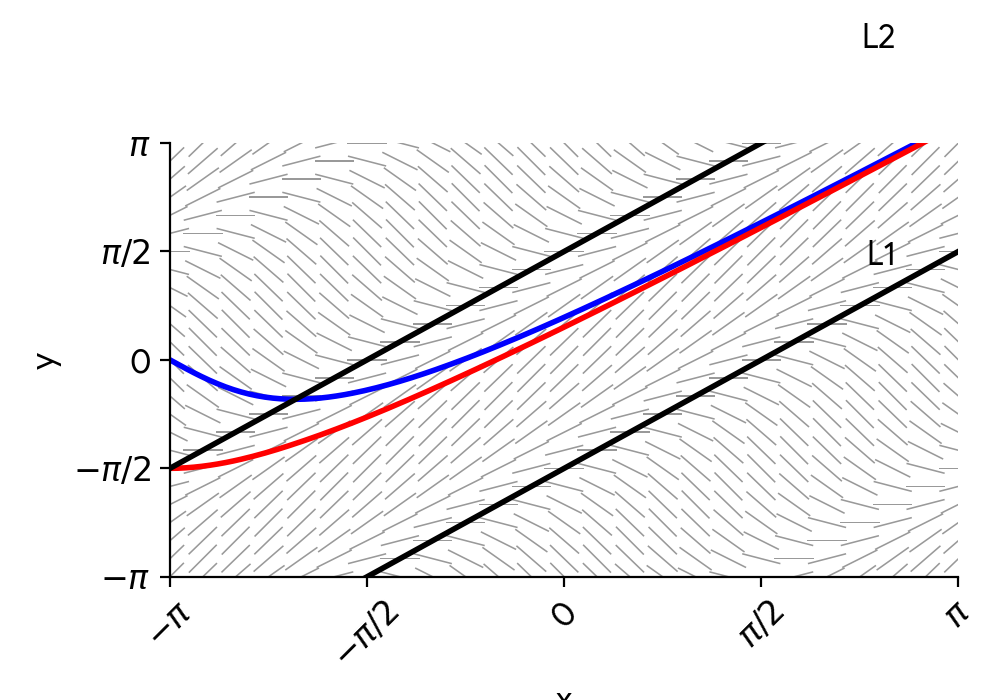
The local maximum points for solutions to the differential equation lie on the straight line .
Find the equation of , giving your answer in the form .
Find the equation of the straight line on which all local minimum points lie within the given domain, giving your answer in the form .
To find local maximum points, you need to find where and then use the second derivative test or analyze the sign change of . Remember to consider the domain for and .
Similar to part (a), but consider the condition for local minimum points. What must be the sign of the second derivative?
Question 9
HardPaper 2 · calculator15 marksA geological survey team is setting up sensors in a remote area. A map of the area is represented on the following coordinate axes.
Three sensor locations are positioned at , and .
All measurements are in kilometres.
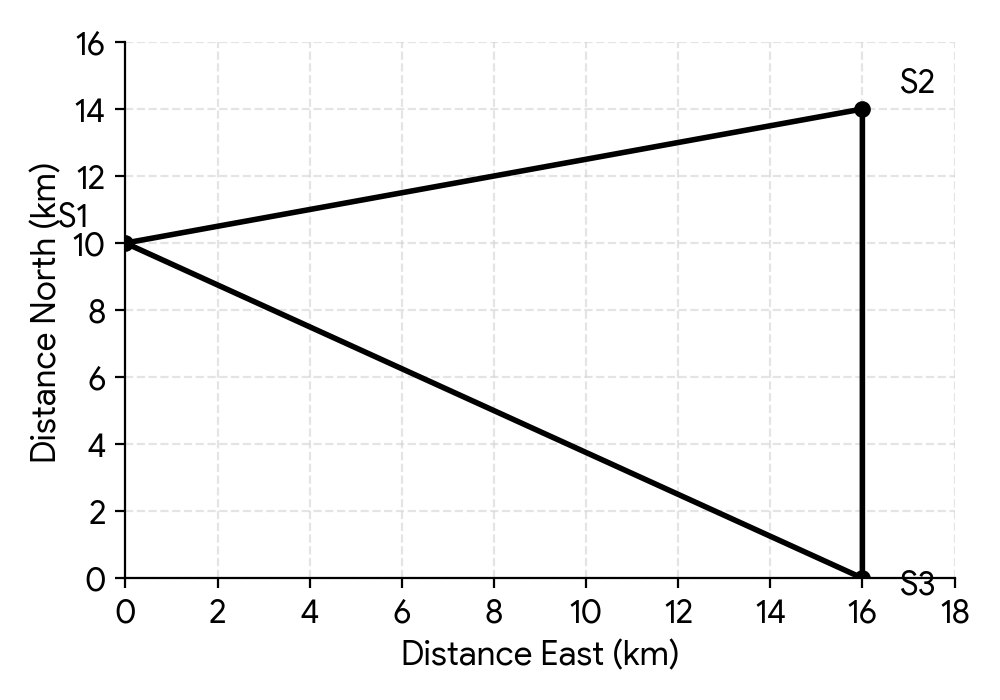
(a) Write down the distance between and .
(b) Calculate the distance between and .
(c) A geological team member is at sensor and needs to walk directly to sensor . Calculate the bearing of from .
A communication relay station is to be installed at a point that is an equal distance from each of the sensors at , , and .
(i) Write down the gradient of the line segment .
(ii) Write down the coordinates of the midpoint of the line segment .
(iii) Hence, calculate the coordinates of the communication relay station.
The distance between two points and can be found using the distance formula . For points on a vertical or horizontal line, this simplifies to the absolute difference in the changing coordinate.
Use the distance formula for the points and . Remember to take the square root of the sum of the squared differences in coordinates.
Bearings are measured clockwise from North. First, determine the change in easting and northing from to . Then, use trigonometry to find the angle relative to the North-South line and convert it to a bearing.
The gradient of a line segment connecting and is given by .
The midpoint of a line segment connecting and is given by .
The communication relay station is equidistant from , , and . This means it is the circumcenter of the triangle formed by these points. The circumcenter is the intersection of the perpendicular bisectors of the sides of the triangle. You already have the gradient and midpoint for . Find the perpendicular bisector for another side, for example , and solve the system of equations.
Question 10
MediumPaper 1 · calculator6 marksA security system is being set up in a warehouse. Laser beams are emitted from various points. On a coordinate plane, where one unit represents 1 meter, the positions of three sensors are given by A(1, 2), B(0, 6), and C(5, 8). A fourth sensor, D, is located on the x-axis.
The main control unit ensures that the path from A to C is perpendicular to the path from B to D.
Find the gradient of the line segment connecting sensor A and sensor C.
Write down the gradient of the line segment connecting sensor B and sensor D.
Find the equation of the line passing through sensor B and sensor D. Give your answer in the form , where and are integers.
Write down the x-coordinate of sensor D.
Recall the formula for the gradient of a line passing through two points and .
Remember the relationship between the gradients of two perpendicular lines.
Use the gradient found in part (b) and the coordinates of point B to form the equation of the line. Then rearrange it into the required form.
Point D lies on the x-axis. What does this tell you about its y-coordinate? Use the equation of the line BD to find the x-intercept.
Question 11
HardPaper 2 · calculator28 marks(a) (i) Consider the function . Find .
(ii) The first section of the stone wall's profile is given by for . A straight glass panel is to be installed tangent to this section of the wall at the point where . Find the equation of this tangent line.
The full profile of the stone wall, , is defined by:
A smaller, decorative stone insert is designed using a transformation of . The graph of is obtained from the graph of by:
- a stretch scale factor of in the direction,
- followed by a stretch scale factor of in the direction,
- followed by a translation of units to the right.
Point P lies on the graph of and has coordinates . Point Q is the image of P under the given transformations and has coordinates .
Find the value of and the value of .
The piecewise function is given by
(c) Find
(i) an expression for .
(ii) the value of .
(iii) the value of .
(d) (i) Calculate the total area of the profile of the stone wall, enclosed by , the -axis, and the line .
The decorative insert is placed within the main wall profile . The region of the main wall profile that is not covered by the insert is to be painted a contrasting colour. This region is bounded by , the -axis, and the lines and , excluding the area under from to . Find the area of this region.
Recall the power rule for differentiation: if , then .
First, find the y-coordinate of the point of tangency. Then, use the derivative from part (a)(i) to find the gradient of the tangent at that point. Finally, use the point-slope form of a linear equation, .
Apply each transformation step-by-step to the coordinates of point P. Remember that a stretch in the x-direction affects the x-coordinate, a stretch in the y-direction affects the y-coordinate, and a translation shifts the point.
To transform a function :
- Stretch by scale factor in -direction: replace with .
- Stretch by scale factor in -direction: replace with (or multiply by ).
- Translate units to the right: replace with .
Combine these transformations to find in terms of , then substitute the expression for the first part of .
The value is the new boundary point for the piecewise function . This corresponds to the original boundary point in after the x-transformations have been applied.
Substitute the second part of (the linear function) into the general transformation equation for derived in part (c)(i). Simplify the expression to find the constant term .
The function is piecewise. You will need to calculate two separate definite integrals and sum their results. The first integral will be for from to , and the second for from to .
The region to be painted consists of two parts: the area under from to , and the area between and from to . You have already calculated some of these areas in previous parts.
Question 12
MediumPaper 1 · calculator7 marksTwo observation posts, Alpha (A) and Bravo (B), are located in a national park. Their positions are given by coordinates in kilometres relative to a central ranger station. Post A is at and Post B is at . A new patrol route is established along the line that is equidistant from both posts. This route is represented by the perpendicular bisector of the line segment [AB].
(a) Find the equation of the line that the patrol route follows.
A supply drop point, Charlie (C), is located on the patrol route. Post C is due east of Post A.
(b) Find the x-coordinate of Post C.
First, find the midpoint of the line segment connecting the two observation posts. Then, calculate the gradient of the line segment [AB]. Remember that the patrol route is perpendicular to [AB], so its gradient will be the negative reciprocal. Finally, use the point-gradient form to find the equation of the line.
If Post C is due east of Post A, what does that tell you about their y-coordinates? Use this information with the equation of the patrol route found in part (a).
Question 13
HardPaper 2 · calculator15 marksA drone delivery service operates from three main hubs, P, Q, and R, whose locations are represented on a coordinate plane. All measurements are in kilometres.
Hub P is at , Hub Q is at , and Hub R is at .
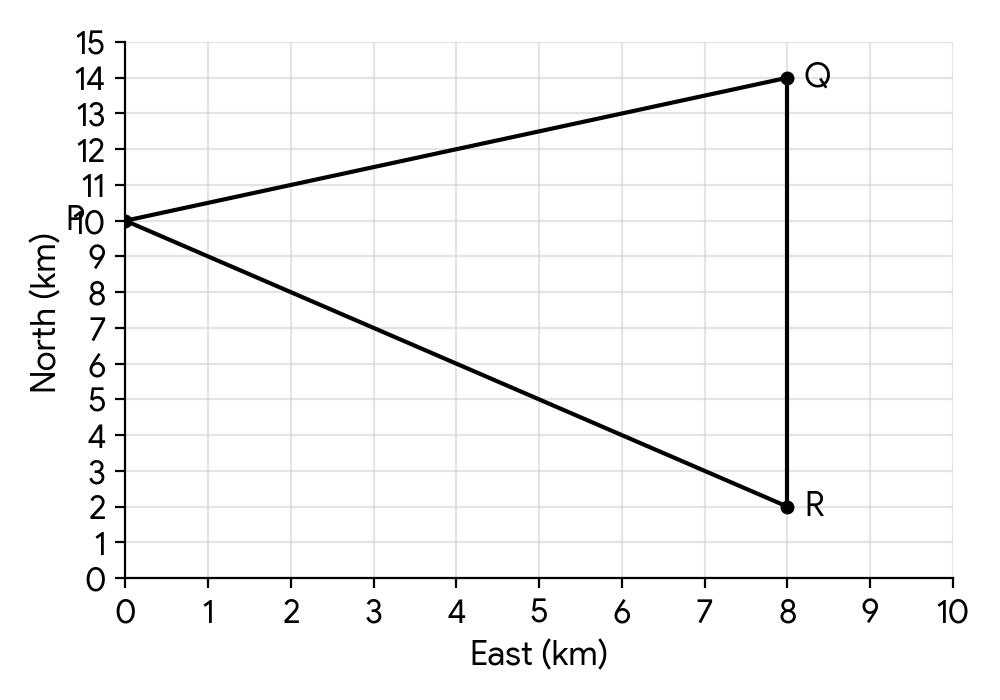
Write down the distance between Hub Q and Hub R.
Calculate the distance between Hub P and Hub Q.
A drone is at Hub Q and needs to fly directly to Hub P. Calculate the bearing of P from Q.
A central charging station is to be built at a location equidistant from Hubs P, Q, and R.
Write down the gradient of the line segment [PR].
Find the coordinates of the midpoint of [PR].
Hence calculate the coordinates of the central charging station.
The hubs Q and R share the same x-coordinate. What does this mean about the line segment connecting them?
Use the distance formula, which is derived from the Pythagorean theorem. Consider the change in x-coordinates and y-coordinates.
First, determine the change in x and y coordinates from Q to P. Then, use trigonometry to find the angle with respect to the North line. Remember bearings are measured clockwise from North and are typically given as three figures.
The gradient of a line segment between two points and is given by .
The midpoint of a line segment between two points and is given by .
The central charging station is the circumcenter of the triangle formed by P, Q, and R. It is the intersection point of the perpendicular bisectors of the sides of the triangle. You'll need the gradient and midpoint of at least two sides to find their perpendicular bisectors.
Question 14
MediumPaper 1 · calculator7 marksTwo historical landmarks are located at points A(4, 10) and B(16, 2) on a coordinate map. A proposed new scenic path, represented by the line R with equation , passes near these landmarks. A new visitor centre is to be built on this scenic path such that it is equidistant from both landmarks.
(a) Find the equation of the perpendicular bisector of the line segment [AB]. Give your equation in the form .
(b) Determine the coordinates of the point on the scenic path R where the visitor centre should be located.
First, calculate the gradient and midpoint of the line segment [AB]. Then, use the negative reciprocal of the gradient to find the gradient of the perpendicular bisector. Finally, use the midpoint and the perpendicular gradient to form the equation of the line.
The visitor centre is at the intersection of the perpendicular bisector (found in part a) and the scenic path R. Solve the two equations simultaneously.
Question 15
HardPaper 2 · calculator20 marks(a) SweetTreats is designing new packaging for a line of artisanal chocolates. The initial design is a box in the shape of a cuboid with a square base of side length cm. Its height, cm, is twice the length of the base.
Write down an expression for in terms of .
(b) The box is designed to hold cm of chocolates.
Find the value of and .
(c) Calculate the total external surface area of the box.
(d) To minimize the amount of material needed, SweetTreats is considering changing the shape to a cylinder with radius cm and height cm. The cylindrical container must also hold cm of chocolates.
Find an expression for the height, , of the container in terms of .
(e) Let the total external surface area of the cylindrical container be cm.
Show that .
(f) Find .
(g.i) Hence or otherwise, find the value of that will minimize .
(g.ii) Find the minimum value of needed for the cylinder.
(h.i) Find .
(h.ii) Hence determine whether the graph of is concave-up or concave-down for . Justify your answer.
The question states a direct relationship between the height and the base length . Express this relationship mathematically.
The volume of a cuboid is given by base area multiplied by height. Use the expression from part (a) to relate the volume to only, then solve for . Once is found, calculate .
The total external surface area of a cuboid with a square base consists of two square bases and four rectangular sides. Use the dimensions found in part (b).
Recall the formula for the volume of a cylinder. Use the given volume to express in terms of .
The total surface area of a cylinder is the sum of the areas of the two circular bases and the curved surface area. Substitute the expression for from part (d) into the surface area formula.
Differentiate the expression for with respect to . Remember that can be written as .
To find the minimum value of , set its derivative to zero and solve for . You may need a GDC for the final calculation.
Substitute the value of found in part (g.i) back into the expression for from part (e).
Differentiate with respect to .
The sign of the second derivative determines concavity. If , the graph is concave-up. If , it's concave-down.
Question 16
MediumPaper 1 · calculator5 marks(a) Write down the gradient of the signal path .
(b) Find the equation of the signal path in the form .
(c) Show that is not the line that is normal to at point .
Remember the relationship between the gradients of two perpendicular lines.
Use the gradient found in part (a) and the coordinates of point P to find the equation of the line.
A line normal to a function at a point must pass through that point. Check if point P lies on line S2.
Question 17
HardPaper 3 · calculator27 marksA botanical garden is researching the growth of a rare orchid species, Orchidaceae splendens, in a controlled greenhouse environment. They are investigating the long-term viability of maintaining a large population.
The population of Orchidaceae splendens, , measured in thousands, is shown in the following table. The time is measured in years from the beginning of 2010, where .
| End of year | (thousands) | |
|---|---|---|
| 2010 | 1 | 0.5 |
| 2011 | 2 | 0.8 |
| 2012 | 3 | 1.0 |
| 2013 | 4 | 1.4 |
| 2014 | 5 | 1.9 |
| 2015 | 6 | 2.6 |
| 2016 | 7 | 4.0 |
The garden models this data set using the logistic function , where .
In context, explain the significance of in this logistic function.
Use the value of at to show that .
Use the value of at to find a second expression for .
Use your answers to part (b) to find a value for .
Use your answers to part (b) to find a value for .
The botanical garden uses its model to predict values of at the end of the years 2011 to 2015. These values are shown in the following table, correct to one decimal place.
| End of year | (actual, thousands) | Predicted values (thousands) | |
|---|---|---|---|
| 2011 | 2 | 0.8 | 0.7 |
| 2012 | 3 | 1.0 | 1.0 |
| 2013 | 4 | 1.4 | |
| 2014 | 5 | 1.9 | 2.0 |
| 2015 | 6 | 2.6 | 2.8 |
Calculate the value of correct to one decimal place.
Using the value of correct to one decimal place, find the sum of square residuals, , when using this model to predict the values of .
As a measure of how well the model fits the data, the botanical garden uses the error function, , where , and is the number of predictions made using the model.
The garden decides they will use this model if is less than .
By finding the value of for the model, show that the garden will decide that the model can be used.
Use the model to predict the population of Orchidaceae splendens in the greenhouse at the end of 2025.
One of the challenges in maintaining the orchid population is providing sufficient specialized protective covers. The botanical garden estimates that of orchids will require a specialized protective cover, and each cover can protect individual orchids.
Use the model to find an expression for the total number of specialized protective covers required at time . Give your answer in thousands of covers.
At the end of 2014 () there were thousand specialized protective covers in the greenhouse, and at the end of 2016 () there were thousand.
Find the average number of specialized protective covers installed per year during this period.
The botanical garden assumes that the number of specialized protective covers will continue to increase linearly, at the same rate, until the population stabilizes.
Determine the value of , where , at which the number of specialized protective covers will first be insufficient to meet demand, and hence the year in which this occurs.
Consider what the value of approaches as becomes very large in a logistic model.
Substitute the given values for and into the logistic function and rearrange the equation to isolate .
Similar to part (b.i), substitute the values for and at and rearrange to express in terms of .
You have two expressions for . Set them equal to each other and solve for . Remember to use logarithms to solve for when it's in the exponent.
Substitute the value of you found in part (c.i) into either of your expressions for from part (b).
The value is the predicted population at . Substitute into your logistic function using the values of and you found.
The residuals are the differences between the actual and predicted values. Square each residual and then sum them up. Remember to use the rounded predicted values from the table.
Use the value you calculated and the number of predictions () to find . Then compare to the threshold of .
First, determine the value of that corresponds to the end of 2025. Then, substitute this value into your logistic function.
Calculate the total number of orchids requiring covers, then divide by the capacity of each cover. Remember to keep units consistent (thousands).
Calculate the change in the number of covers and divide by the change in years.
First, create a linear equation for the supply of covers based on the information in part (i). Then, set the demand for covers (from part h) equal to the supply of covers and solve for . You may need to use your GDC to solve this equation graphically or numerically. Finally, convert the value of to the corresponding year.
Question 18
MediumPaper 1 · calculator6 marksThree sensor stations, Alpha (A), Beta (B), and Gamma (C), are positioned in a national park. Their coordinates are A(2, 8), B(10, 4), and C(6, 0) respectively.
The diagram below shows these points and the perpendicular bisectors of the segments connecting them.
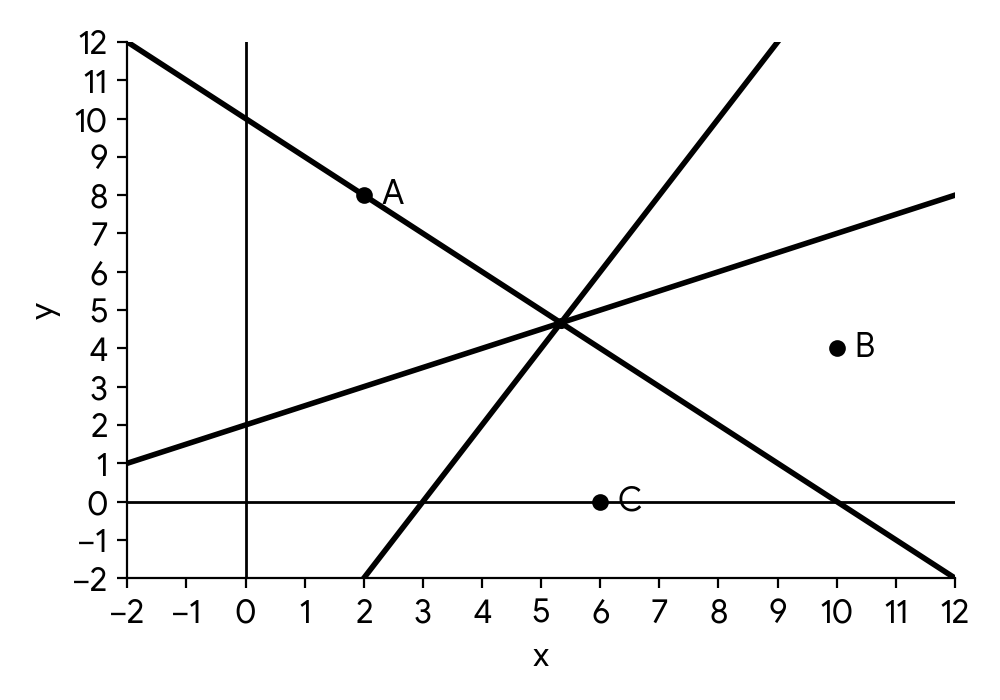
The perpendicular bisector of the line segment [BC] intercepts the axes at coordinates (0, 10) and (10, 0).
Write down the equation of the perpendicular bisector of [BC].
The equation of the perpendicular bisector of [AB] is .
Find the coordinates of point V, where the three perpendicular bisectors meet. Give your answer to four significant figures.
A Voronoi diagram is constructed with sensor stations A, B, and C as the three sites.
Draw, clearly, the edges of the Voronoi diagram on the given diagram.
Recall the formula for the equation of a straight line given two points or its intercepts. The intercepts provided can help determine the gradient and y-intercept.
To find the intersection point of two lines, set their equations equal to each other and solve for x, then substitute x back into one of the equations to find y. Remember to round to four significant figures.
The edges of a Voronoi diagram are the perpendicular bisectors of the line segments connecting adjacent sites. The intersection point V is a vertex of the Voronoi diagram.
Question 19
HardPaper 1 · calculator7 marksA robotics engineer is programming a swarm of drones. The initial paths of the drones are given by a family of lines, , with equation , where is a real parameter and .
A control signal applies a linear transformation to the coordinates of every drone, described by the matrix .
The new path of a drone is the line .
(a) Find a vector equation for the line in terms of .
(b) Find the determinant of .
(c) Show that all the drones will end up moving along the same path, by showing that the equation of the transformed line does not depend on .
A vector equation of a line is of the form , where is a position vector of a point on the line and is a direction vector. How can you find a point and the direction from the Cartesian equation ?
The determinant of a 2x2 matrix is calculated as .
You can approach this in several ways. One way is to transform the vector equation from part (a) using the matrix . Another way is to transform two general points from the line . A third way is to consider the relationship between the coordinates of a transformed point and the original point .
Question 20
MediumPaper 1 · calculator9 marksA landscape architect is designing a walking path in a new park. The path consists of three segments. The first segment is a straight path connecting point A(0, 0) to point B(2, 4).
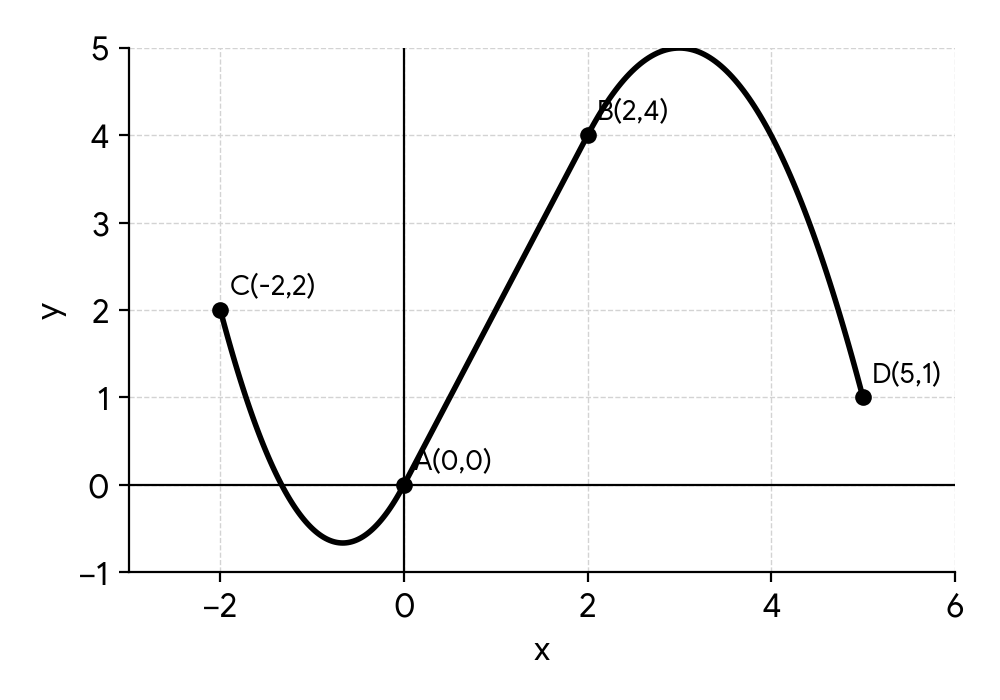
Write down the equation of the line segment for .
A curved section of the path, modeled by a quadratic function, connects point C(-2, 2) to point A(0, 0). At point A(0, 0), the curve has the same gradient as the straight path segment AB.
Find the equation of the curve between (-2, 2) and (0, 0).
The second curved section of the path, also modeled by a quadratic function, connects point B(2, 4) to point D(5, 1). At point B(2, 4), the curve has the same gradient as the straight path segment AB.
Find the equation of this curve.
Write down the equation of the entire walking path as a piecewise function, .
Recall the formula for the equation of a straight line given two points. The gradient can be found using the coordinates of points A and B.
Assume the quadratic equation is of the form . Use the given points and the gradient condition at (0,0) to set up and solve a system of equations for a, b, and c.
Similar to part (b), use the general quadratic form . You have two points and one gradient condition, which will lead to a system of three linear equations in a, b, and c.
Combine the equations from parts (a), (b), and (c), specifying the correct domain for each segment.
No question on this page matches those filters. Try another difficulty or paper.
42 more Straight line (gradient-int, general, point gradient form) questions in the app
Every answer is marked mark by mark, IB-style, and the AI tutor helps when you are stuck.
Where marks are lost
- Using your own wrong value after failing a "show that." All follow through is withdrawn for the rest of that question.
