Conditional probability and independent events: notes and practice questions
- Conditional Probability: Event A occurs given event B has already occurred.
- Independent Events: Occurrence of one does not affect the probability of the other; and .
- Intersection (AND): Both event A and event B occur, denoted .
- Union (OR): Event A or event B or both occur, denoted .
- Complement (NOT): Event A does not occur, denoted .
- Mutually Exclusive Events: Cannot happen simultaneously; .
- Complement Rule: .
- Mutually Exclusive Events Rule: .
- Independent Events Rule: (primary test for independence).
- Conditional Probability Formula: .
- Rearranged Conditional Probability: .
- Venn Diagrams: Fill from the center (intersections) outwards.
- To find from Venn: Numerator is , Denominator is .
- Tree Diagrams: Place the event with known conditional probabilities on the first set of branches.
- Tree Diagrams: Multiply probabilities along branches to find intersections (e.g., ).
- Use GDC equation solver for algebraic unknowns in Venn diagrams.
- Always draw a Venn or Tree diagram, even if not explicitly asked.
- For Tree Diagrams, only draw specific branches relevant to the calculation.
- Use algebra (e.g., 'x') for missing parts in Venn diagrams to form equations (e.g., sum of probabilities = 1).
- Conditional probability and independent events concepts are identical for SL and HL AI.
How it is examined
A guaranteed question. Tree diagrams with and without replacement are the most common form, and the second-stage probabilities changing is the whole point of the "without replacement" version. Because a diagram alone is an acceptable solution, a mark scheme has to award the diagram, which matters for handwritten answers. Testing independence means checking and stating the conclusion, and students often compute without concluding.
The combined events rule, the conditional probability rule, and the independence condition.
- The use of Venn diagrams, tree diagrams, sample space diagrams and tables of outcomes to calculate probabilities.
- Combined events, .
- Mutually exclusive events, .
- Conditional probability, .
Linking questions
- Aim 8: the gambling issue, and the use of probability in casinos. Could or should mathematics help increase incomes in gambling?
- TOK: can calculating gambling probabilities be considered an ethical application of mathematics? Should mathematicians be held responsible for unethical applications of their work?
Practice questions
33 questions · 23 medium · 10 hardQuestion 1
MediumPaper 1 · calculator11 marksIn a security system, two independent sensors, System A and System B, report a threat level for an incident. System A reports a level with probabilities , , . System B reports a level with probabilities , , , . The overall threat assessment, , for an incident is defined as the higher of the two reported threat levels (i.e., ).
Complete the following table to show the probability distribution of .
| 1 | 2 | 3 | 4 | |
|---|---|---|---|---|
Find the probability that an incident has an overall threat assessment of at least 3.
Given that the overall threat assessment is at least 3, find the probability that System A reported a level of 2.
Calculate the expected overall threat assessment, .
Consider all possible pairs of and their joint probabilities. For each pair, determine and sum the probabilities for each unique value of .
Recall how to sum probabilities from a discrete probability distribution for a given range of values.
Remember the formula for conditional probability: . Identify events A and B correctly.
The expected value of a discrete random variable is the sum of each possible outcome multiplied by its probability.
Question 2
HardPaper 1 · calculator6 marks(a) A popular cafe uses a specialty espresso machine that has an 85% probability of functioning correctly on any given morning. The probability of the machine functioning correctly on a given morning is independent of it functioning on any other morning.
Find the probability that the espresso machine functions correctly on exactly four mornings in a particular 5-day workweek.
(b) If the specialty espresso machine does not function correctly, the cafe owner must decide whether to use a backup machine or close early for the day. The cafe owner closes early if the specialty machine does not function correctly AND the backup machine is not available. There is a 70% probability that the backup machine is available on any given morning, independent of the specialty machine's status or any other morning.
Find the probability that the cafe owner does not have to close early in a particular 5-day workweek.
Recall the formula for binomial probability: . Identify the number of trials (n), the probability of success (p), and the number of successes (k) for this scenario.
First, calculate the probability of closing early on a single day. This happens if the specialty machine fails AND the backup machine is unavailable. Then, find the probability of not closing early on a single day. Finally, use the binomial distribution for the 5-day workweek.
Question 3
MediumPaper 1 · calculator6 marksA company conducted performance reviews for 120 employees across two departments: Marketing and Engineering. The outcomes are summarized in the following table.
| Department | Excellent | Needs Improvement |
|---|---|---|
| Marketing | 28 | 32 |
| Engineering | 45 | 15 |
An employee is chosen at random from this group.
(a) Find the probability that the randomly chosen employee received an 'Excellent' rating.
(b) Given that the chosen employee received an 'Excellent' rating, find the probability that they work in the Marketing department.
(c) Two different employees are chosen at random from the original group. Find the probability that both employees work in the Marketing department.
To find the probability of an event, divide the number of favorable outcomes by the total number of possible outcomes. In this case, count the total number of 'Excellent' ratings and the total number of employees.
This is a conditional probability question. You are given that the employee received an 'Excellent' rating, so your sample space is reduced to only those employees with an 'Excellent' rating. Then, find how many of those work in Marketing.
This involves probability without replacement. Consider the probability of the first employee being from Marketing, and then the probability of the second employee also being from Marketing, given that the first one was already chosen.
Question 4
HardPaper 1 · calculator9 marksA manufacturing plant produces electronic components. Each component undergoes two independent quality checks: Quality Check 1 (QC1) and Quality Check 2 (QC2).
The probability that a component passes QC1 is . The probability that a component passes QC2 is .
(a) Find the probability that a randomly selected component passes both quality checks.
(b) Find the probability that a randomly selected component passes at least one quality check.
(c) Find the probability that a randomly selected component passes Quality Check 1 but fails Quality Check 2.
(d) Find the probability that a randomly selected component passes Quality Check 2, given that it failed Quality Check 1.
Remember the rule for the intersection of two independent events.
Consider the formula for the union of two events.
If two events are independent, then an event and the complement of the other event are also independent.
Recall the definition of conditional probability. How does independence affect conditional probability?
Question 5
MediumPaper 1 · calculator6 marks[Maximum mark: 6]
A university is investigating the relationship between student engagement in extracurricular activities and their academic performance. A random sample of 470 students was selected, and their engagement level (Low, Medium, High) and academic performance (Below Average, Average, Above Average) were recorded. The data is summarized in the following table.
| Low Engagement | Medium Engagement | High Engagement | Total | |
|---|---|---|---|---|
| Below Average | 45 | 30 | 15 | 90 |
| Average | 60 | 90 | 70 | 220 |
| Above Average | 25 | 50 | 85 | 160 |
| Total | 130 | 170 | 170 | 470 |
An item of food is chosen at random from these 500.
(a) Find the probability that a randomly chosen student has 'Below Average' academic performance, given that they have 'Low' engagement.
A test at the 5% significance level is carried out to determine if there is a significant relationship between student engagement and academic performance.
The critical value for this test is 9.488.
The hypotheses for this test are:
: Student engagement in extracurricular activities and academic performance are independent.
: Student engagement in extracurricular activities and academic performance are not independent.
(b) Find the statistic.
(c) State, with justification, the conclusion for this test.
Recall the formula for conditional probability: P(A|B) = P(A and B) / P(B). Identify the event A and event B from the question, and use the counts from the table.
Use your GDC's chi-squared test function. Input the observed frequency table to calculate the chi-squared statistic.
Compare the calculated statistic from part (b) with the given critical value. Alternatively, compare the p-value (which your GDC also provides) with the significance level (0.05).
Question 6
HardPaper 1 · calculator12 marksThe lifespan of a certain brand of smartphone battery is normally distributed with a mean of days and a standard deviation of days.
(a) The probability that a randomly selected battery lasts less than days is . Find the value of .
(b) A battery is randomly selected. It is known that the battery lasts longer than days. What is the probability that it lasts longer than days?
(c) A retailer orders batteries. What is the probability that at most of them have a lifespan less than days?
For a normally distributed variable with mean and standard deviation , if you are given and need to find , you should use the inverse normal function on your GDC. Remember to input the area, mean, and standard deviation correctly.
This is a conditional probability problem. Recall the formula . In this case, is the event that the battery lasts longer than days, and is the event that it lasts longer than days. Since lasting longer than days implies lasting longer than days, simplifies to .
This problem involves a large number of trials, suggesting a binomial distribution that can be approximated by a normal distribution. First, calculate the probability of a single battery having a lifespan less than days using the normal distribution. Then, use this probability to define the parameters (mean and variance) of the normal approximation to the binomial distribution. Remember to apply a continuity correction when approximating a discrete distribution with a continuous one.
Question 7
MediumPaper 1 · calculator6 marksA bakery produced a batch of 200 loaves of bread, consisting of sourdough and rye. The sales outcomes for these loaves are shown in the following table.
| Sold | Unsold | |
|---|---|---|
| Sourdough | 45 | 30 |
| Rye | 60 | 65 |
(a) Find the probability that a randomly chosen loaf from this batch was sold by the bakery.
A loaf is chosen at random from this batch. It is found that this loaf was sold.
(b) Find the probability that the loaf was a sourdough loaf.
Two different loaves are chosen at random from the original batch of 200 loaves.
(c) Find the probability that both loaves were rye.
To find the probability of an event, divide the number of favourable outcomes by the total number of possible outcomes. First, determine the total number of loaves sold.
This is a conditional probability problem. You are given that the loaf was sold, so your sample space is reduced to only the sold loaves. Then, find the number of sourdough loaves among those sold.
This involves probability without replacement. Calculate the probability of the first loaf being rye, then consider how the total number of loaves and the number of rye loaves changes for the second selection.
Question 8
HardPaper 1 · calculator12 marksTwo unbiased dice, each with faces numbered from 1 to 6 inclusive, are rolled. The numbers on the uppermost faces of the dice are noted.
Let the random variable be the sum of the numbers on the dice.
(a)(i) Find .
(a)(ii) Find .
(b) Complete the table to show the probability distribution of .
The probability that is shown.
| 2 | 3 | 4 | 5 | 6 | 7 | 8 | 9 | 10 | 11 | 12 | |
|---|---|---|---|---|---|---|---|---|---|---|---|
(c) Calculate .
(d) Given that the sum of the numbers on the dice is a prime number, find the probability that .
List all possible outcomes when rolling two dice and identify those where the sum is 7. Remember there are total possible outcomes.
Similar to part (a.i), identify the outcomes where the sum is 10.
Systematically list all possible sums and the number of ways each sum can be achieved. Remember that the sum of all probabilities must equal 1.
The expected value is calculated as . Use the probabilities from your completed table.
Recall the definition of conditional probability: . First, identify all prime sums and calculate the probability of getting a prime sum.
Question 9
MediumPaper 1 · calculator6 marksA factory produces two types of electronic components: standard (S) and premium (P). The weight of these components is a critical characteristic for quality control.
The weights of standard components are known to be normally distributed with a mean of 150 grams and a standard deviation of 5 grams.
The weights of premium components are known to be normally distributed with a mean of 165 grams and a standard deviation of 8 grams.
A quality control machine classifies a component as 'premium' if its weight is found to be above 158 grams; otherwise, it is classified as 'standard'.
The factory's quality control manager uses the null hypothesis that, in the absence of other information, a component is standard.
Calculate the probability of making a Type I error when classifying a component.
Calculate the probability of making a Type II error when classifying a component.
It is known that 80% of the components produced are standard, and 20% are premium.
Calculate the overall probability that a randomly selected component is misclassified by the machine.
A Type I error occurs when the null hypothesis is true, but it is rejected. In this context, consider which type of component is incorrectly classified as the other.
A Type II error occurs when the null hypothesis is false, but it is not rejected. In this context, consider which type of component is incorrectly classified as the other.
Consider the total probability of error by combining the probabilities of Type I and Type II errors with the prior probabilities of each component type.
Question 10
HardPaper 2 · calculator19 marksA manufacturing company inspects the first 50 items produced each morning for defects.
(a) State the sampling method being used.
The company uses an automated machine to test products for defects. This machine is not perfect.
It is known that 3% of all products manufactured are defective (D).
If a product is defective, the machine correctly identifies it as defective (tests positive, ) 98% of the time.
If a product is not defective (D'), the machine incorrectly identifies it as defective (tests positive, ) 1% of the time.
The tree diagram shows some of this information.
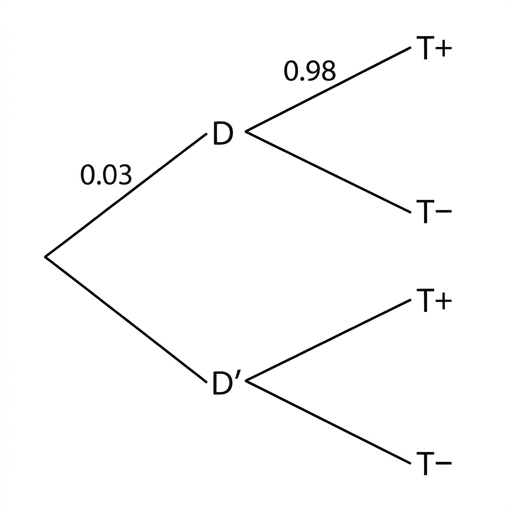
(b) (i) Write down the value of .
(ii) Write down the value of .
(iii) Write down the value of .
(iv) Write down the value of .
(c) Use the tree diagram to find the probability that a randomly selected product:
(i) is not defective and tests positive.
(ii) tests negative.
(iii) is defective given that it tested negative.
(d) The company finds the actual number of defective products in their sample is different than predicted by the tree diagram. Explain why this might be the case.
(e) The factory manager surveyed all employees on a particular shift. All employees on this shift worked in at least one of these departments: Assembly (A), Painting (P), or Quality Control (Q). It was found that:
- 85 employees worked in Assembly;
- 55 employees worked in Painting;
- 35 employees worked in Quality Control;
- 10 employees worked in all three departments;
- 20 employees worked in Assembly and Quality Control but not Painting;
- 15 employees worked in Assembly and Painting but not Quality Control;
- 4 employees worked only in Quality Control.
Draw a Venn diagram to illustrate this information, placing all relevant information on the diagram.
(f) Find the total number of employees on this shift.
Consider how the sample is chosen. Is it completely random, or is there a specific, non-random criterion for selection?
The sum of probabilities for all possible outcomes at any branch point must be 1.
The sum of probabilities for all possible outcomes at any branch point must be 1. If is given, how can you find ?
This value is directly given in the problem description.
The sum of probabilities for all possible outcomes at any branch point must be 1. If is given, how can you find ?
To find the probability of two independent events both occurring, multiply their individual probabilities.
A product can test negative in two ways: it is defective and tests negative, or it is not defective and tests negative. Sum these probabilities.
This is a conditional probability problem. Recall Bayes' Theorem: .
Consider the nature of the sampling method used and how it relates to the entire population of products.
Start by filling in the innermost region (the intersection of all three sets) and then work outwards to the two-set intersections and single-set regions. Remember that 'only' means not in any other specified set.
Sum the numbers in all the distinct regions of your Venn diagram.
Question 11
MediumPaper 1 · calculator6 marksLeo is a student who takes a short mathematics quiz every day for five days each week. He has a 70% probability of passing any given quiz. The outcome of one quiz is independent of any other quiz.
(a) Find the probability that Leo passes exactly three quizzes in a particular five-day week.
Leo studies for his quiz with a 60% probability on any given morning, independent of whether he passes the quiz or not. Leo is considered 'well-prepared' for a quiz if he passes the quiz AND he studied for it.
(b) Find the probability that Leo is not well-prepared on any day in a particular five-day week.
This problem involves a fixed number of trials (quizzes), each with two possible outcomes (pass or fail), and a constant probability of success. Consider which probability distribution is appropriate for this scenario.
First, calculate the probability that Leo is 'well-prepared' on a single day. Then, find the probability that he is 'not well-prepared'. Finally, use this probability to determine the chance of this event happening for all five days.
Question 12
HardPaper 2 · calculator14 marksThe diameter of a certain type of industrial component is modelled by a normal distribution with a mean of mm and a standard deviation of mm.
Find the probability that a randomly selected component has a diameter less than mm.
Find the probability that a randomly selected component has a diameter greater than mm.
Assuming the diameters of components are independent, find the probability that two consecutive components both have a diameter greater than mm.
A component is classified as 'premium' if its diameter is between mm and mm. A batch of three components is considered 'high quality' if all three components in the batch are premium. Find the probability that a randomly selected batch is NOT high quality.
In a production run, batches of three components are produced. Find the probability that at least of these batches are high quality.
Find the probability that between and (exclusive of ) of these batches are high quality.
Given that at least batches are high quality, find the probability that less than batches are high quality.
Use the normal cumulative distribution function (CDF) on your GDC. Remember that is directly calculated by the CDF.
Use the normal cumulative distribution function (CDF) or the normal survival function (SF) on your GDC. Remember that .
For independent events and , the probability of both occurring is .
First, find the probability that a single component is 'premium'. Then, use this to find the probability that a batch of three is 'high quality'. Finally, calculate the complementary probability.
This scenario involves a fixed number of trials (batches), each with two possible outcomes (high quality or not), and the trials are independent. This suggests a binomial distribution. Remember .
This means finding , which is equivalent to .
This is a conditional probability problem: . Here, is 'less than batches are high quality' and is 'at least batches are high quality'. The intersection is 'between and (exclusive of ) batches are high quality'.
Question 13
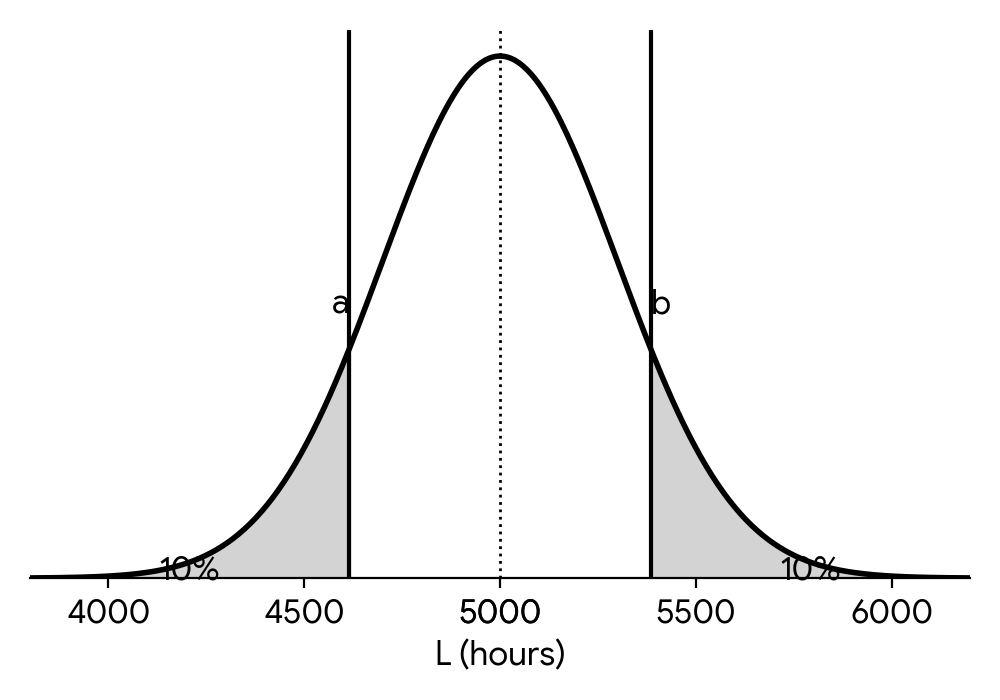
MediumPaper 1 · calculator7 marksA new type of LED bulb has a lifespan, , which is normally distributed with a mean of 5000 hours and a standard deviation of 300 hours.
The following curve represents this distribution. It is known that and .
(a) Calculate the probability that a randomly selected LED bulb lasts more than 4700 hours.
(b) (i) Find the value of .
(b) (ii) Find the value of .
(c) Two LED bulbs are selected at random from a large batch. Find the probability that they both have a lifespan less than 4700 hours.
Use your GDC's normal CDF function. Remember that .
Use your GDC's inverse normal function with the given probability and distribution parameters.
Remember that implies . Use your GDC's inverse normal function.
The events are independent. You'll need the probability from your work in part (a).
Question 14
HardPaper 2 · calculator17 marksA company manufactures custom-designed shelving units. The number of shelf segments in a unit is determined by a "tier number", . The th tier number, , represents the total number of individual shelf segments required to build a triangular display unit with levels, and is defined as .
Calculate the total number of shelf segments required for a unit with 6 levels, .
Determine the formula for in the form .
A designer combines two units: one with 5 levels and another with 4 levels. Find the total number of shelf segments needed, .
Find the simplest expression for the total number of shelf segments required if a designer combines a unit with levels and another with levels, i.e., .
In a quality control batch, there are 15 standard shelf segments and 10 reinforced shelf segments. Two segments are chosen at random from the batch without replacement.
Calculate the probability that the two segments are of different types (one standard, one reinforced).
A new batch of shelf segments contains standard segments and reinforced segments. Two segments are chosen at random from the batch without replacement.
Show that the probability that the two segments are of different types is independent of .
Recall the definition of as a sum. You can either sum the first 6 natural numbers directly or use the formula for the sum of an arithmetic series.
The sum is an arithmetic series. Use the formula for the sum of an arithmetic series, or , where and . Then expand and simplify to match the given form.
First, calculate and using the definition or formula from part (a). Then, add these values together.
Substitute the formula for from part (a.ii) and the corresponding expression for into the sum. Then, simplify the algebraic expression.
Consider the two possible orders for drawing different types of segments: (Standard then Reinforced) or (Reinforced then Standard). Calculate the probability for each order and then add them together. Remember to adjust the total number of segments for the second draw since it's without replacement.
Use the formula for the probability of drawing two different types, similar to part (c), but using and . Substitute the expressions for and and the simplified expression for from part (b.ii). Simplify the resulting algebraic expression to show that cancels out.
Question 15
MediumPaper 1 · calculator6 marksA local university collects data on student performance in two elective courses: 'Introduction to Robotics' (R) and 'Advanced Data Structures' (D). It is found that the event a student passes Robotics is independent of the event a student passes Data Structures.
The probability that a student passes both courses is , and the probability that a student fails Robotics but passes Data Structures is .
Find the probability that a student either fails Introduction to Robotics or passes Advanced Data Structures (or both).
Recall the properties of independent events, the relationship between intersection and union, and how to use complements in probability. Start by finding the individual probabilities of passing each course.
Question 16
HardPaper 2 · calculator15 marksTech Solutions Inc. is a customer support company. They are analyzing their call center efficiency. Over a long period, they collect data on the number of calls, , already in the queue when a new customer's call arrives. The probability distribution of is shown in the following table.
| Number of calls in queue, | 0 | 1 | 2 | 3 | |
|---|---|---|---|---|---|
| P() | 0.15 | 0.30 | 0.35 | 0.20 | 0 |
Find the probability that there are at least two calls in the queue when a new customer's call arrives.
Find E().
The time in seconds, , taken to resolve a single customer's issue can be modelled by the normal distribution .
The company's management estimates that the expected total time a new customer will wait before their issue is resolved can be found by calculating E() E().
Find the value of E() E().
The company considers a service time to be 'long' if it takes more than three minutes to resolve a single customer's issue.
Using the distribution of given above, find the probability that it takes more than three minutes to resolve a randomly selected customer's issue.
Find the probability it takes more than four minutes in total to resolve two randomly selected customers' issues. You may assume all service times are independent of all other service times.
The company assumes that when a new customer's call arrives, the person at the front of the queue has only just reached a support agent. They also assume that if there are three or more customers already in the queue, the new customer will definitely wait more than three minutes before being served.
Using these assumptions and the probabilities for given in the table above,
find the probability a customer just arriving at the call center will wait more than three minutes before being served.
The company has a policy to employ more staff if the probability that a customer has to wait more than three minutes before being served is greater than .
Hence state whether Tech Solutions Inc. will decide to employ more staff.
To find the probability of 'at least two calls', sum the probabilities for and .
The expected value E() is calculated as the sum of (each value of its corresponding probability ).
Recall that for a normal distribution , the expected value E() is simply . Then multiply this by E() found in part (a.ii).
Convert three minutes to seconds. Then use your GDC to find for the given normal distribution.
If and are independent normal random variables, then their sum is also a normal random variable. The mean of the sum is the sum of the means, and the variance of the sum is the sum of the variances.
Consider the different scenarios for the number of customers in the queue ().
If , the wait time is 0.
If , the wait time is .
If , the wait time is .
If , the wait time is assumed to be minutes.
Compare the probability calculated in part (e.i) with the threshold of .
Question 17
MediumPaper 1 · calculator8 marksIn a survey of students at a high school, data was collected on their subject choices. It was found that students were studying Mathematics, and students were studying Physics.
Every student surveyed was studying at least one of these two subjects.
(a) Determine how many students were studying both Mathematics and Physics.
(b) Find the probability that a randomly selected student studies Mathematics, but not Physics.
(c) Explain why the events "studying Mathematics" and "studying Physics" are not independent events.
Recall the formula for the union of two sets: .
First, find the number of students who study Mathematics only. Then divide by the total number of students.
For two events and to be independent, must equal . Calculate these values and compare them.
Question 18
HardPaper 2 · calculator13 marksThe number of customers arriving at a popular bakery during peak hours can be modelled by a Poisson distribution. During a 30-minute busy period, customers arrive at a mean rate of 7.8 customers.
(a)
(i) Find the probability that exactly 6 customers arrive during a 30-minute busy period.
(a)
(ii) Find the most likely number of customers that would arrive during a 30-minute busy period.
(a)
(iii) Given that more than 8 customers arrive during a 30-minute busy period, find the probability that exactly 10 customers arrive.
(b) During quiet periods of the day, customers arrive at a mean rate of 2.1 customers every 15 minutes.
Find the probability that during a period of 45 minutes, of which the first 30 minutes is busy and the next 15 minutes is quiet, exactly 5 customers arrive.
Recall the probability mass function for a Poisson distribution: .
The mode of a Poisson distribution is if is not an integer. If is an integer, both and are modes.
Use the formula for conditional probability: . In this case, is and is . Note that if , then is automatically true, so .
Consider the two periods as independent Poisson processes. You can either sum the probabilities of all combinations that result in 5 customers, or combine the two independent Poisson distributions into a single one.
Question 19
MediumPaper 2 · calculator12 marksA group of students were surveyed about their participation in three extracurricular clubs: Environmental Club (E), Music Club (M), and Theater Club (T). The probabilities of their participation are represented in the Venn diagram below.
| Region | Probability |
|---|---|
| P(E only) | 0.18 |
| P(M only) | 0.23 |
| P(T only) | 0.15 |
| P(E M only) | 0.12 |
| P(E T only) | 0 |
| P(M T only) | 0.05 |
| P(E M T) | 0 |
| P(Neither E, M, nor T) | 0.27 |
Justify that events M and T are not independent.
Explain why events E and T are mutually exclusive.
Determine whether events E and M are independent.
Determine whether events E' and M' are mutually exclusive.
Find P(T E').
For two events to be independent, the probability of their intersection must be equal to the product of their individual probabilities. Calculate both sides and compare.
Recall the definition of mutually exclusive events in terms of their intersection.
Calculate P(E), P(M), and P(E M) from the Venn diagram. Then check the condition for independence.
Events E' and M' are mutually exclusive if P(E' M') = 0. Recall that E' M' is equivalent to (E M)'.
P(T E') means the probability of a student being in the Theater Club but NOT in the Environmental Club. Identify the regions that satisfy this condition.
Question 20
HardPaper 2 · calculator18 marksThe battery life, in hours, of a particular smartphone model, , can be modelled by a normal distribution with a mean of 24 hours and a standard deviation of 2 hours.
(a) Find the probability that a randomly selected smartphone has a battery life greater than 27 hours.
Two smartphones are selected at random and independently of each other.
(b) (i) Find the probability that both smartphones have a battery life greater than 27 hours.
(b) (ii) Find the probability that their total battery life is greater than 52 hours.
A software update is released which is claimed to improve battery life. The manufacturer decides to take a random sample of 20 smartphones to test this claim at the 1% significance level, assuming the standard deviation of the battery life has not changed.
(c) Write down the null and alternative hypotheses for the test.
(d) Find the critical region for this test.
Unknown to the manufacturer, the software update has resulted in all smartphones having a 5% longer battery life than the original model.
(e) Find the mean and standard deviation of the battery life for smartphones with the update.
(f) Find the probability of a Type II error in the manufacturer’s test.
Use your GDC's normal distribution function to find the probability for a single smartphone. You are looking for P(L > 27).
The selections are independent. How do you combine probabilities of independent events?
Recall the rules for the mean and variance of the sum of two independent random variables: and . Remember that the standard deviation is the square root of the variance.
The null hypothesis represents 'no change' from the original mean, while the alternative hypothesis represents the manufacturer's claim that the battery life has improved.
The critical region is the set of sample mean values that would lead you to reject the null hypothesis. Find the value `c` such that the probability of the sample mean being greater than `c` is equal to the significance level, under the null hypothesis.
A 5% increase means the new value is 105% of the old value. How does multiplying a random variable by a constant `k` affect its mean and standard deviation?
A Type II error is failing to reject the null hypothesis when it is false. This means the sample mean falls outside the critical region found in part (d). You need to calculate this probability using the true (new) distribution parameters found in part (e).
No question on this page matches those filters. Try another difficulty or paper.
13 more Conditional probability and independent events questions in the app
Every answer is marked mark by mark, IB-style, and the AI tutor helps when you are stuck.
Where marks are lost
- Using your own wrong value after failing a "show that." All follow through is withdrawn for the rest of that question.
