Normal distribution + bell curve (+inv normal): notes and practice questions
- Normal distribution is a continuous probability distribution.
- Notation: , where is the population mean and is the population variance.
- The distribution is symmetrical, bell-shaped, and has a single mode.
- Changing translates the entire graph horizontally.
- Changing alters the curve's shape: small results in a tall, narrow curve; large results in a short, wide curve.
- The total area under the normal curve is always 1.
- 68-95-99.7 Rule:
- 68% of data lies within one standard deviation of the mean ().
- 95% of data lies within two standard deviations of the mean ().
- 99.7% of data lies within three standard deviations of the mean ().
- For any continuous distribution, the probability of the random variable taking a single exact value is zero: .
- Consequently, and .
- To calculate probabilities for a range (), use your GDC's Normal Cumulative Distribution (NCD) function with lower bound (), upper bound (), mean (), and standard deviation ().
- If given variance (), always calculate standard deviation as for GDC input.
- For , use a sufficiently large upper bound (e.g., ) in NCD.
- For , use a sufficiently small lower bound (e.g., ) in NCD.
- Inverse Normal Distribution: Used to find the data value () when the probability (area) is given.
- For : Use GDC's Inverse Normal (InvN) function with area (), mean, and standard deviation (left tail).
- For : If GDC has a 'right tail' option, use it. Otherwise, use the complement rule and input as the area for a 'left tail' calculation.
- Always use NCD for calculating probabilities and InvN for working backwards from probabilities; ignore Normal Probability Density (NPD).
- Always input the standard deviation () into the GDC, never the variance ().
- Sketch a bell curve to visualize the probability area or tail.
- Check the sense of inverse normal answers (e.g., if , then must be less than ).
- is evaluated identically to due to .
- HL students also cover linear combinations of normal random variables and using sample mean distributions for Confidence Intervals.
How it is examined
The exclusion of -scores is the single most useful fact here, and it is the biggest difference from AA. Everything is done on the GDC with and given. Inverse normal questions give the mean and standard deviation and ask for a cut-off, which is the harder direction for students because the calculator needs a tail specified. Sketching the curve with the region shaded is often worth a mark, so this subtopic wants drawing support.
- The normal distribution and curve.
- Properties of the normal distribution.
- Diagrammatic representation.
- Normal probability calculations.
Linking questions
- Links to other subjects: normally distributed real-life measurements and descriptive statistics (sciences, psychology, environmental systems and societies).
- Aim 8: why might the misuse of the normal distribution lead to dangerous inferences and conclusions?
- International-mindedness: De Moivre's derivation of the normal distribution and Quetelet's use of it to describe l'homme moyen.
- TOK: to what extent can we trust mathematical models such as the normal distribution? How can we know what to include, and what to exclude, in a model?
Practice questions
42 questions · 25 medium · 17 hardQuestion 1
MediumPaper 1 · calculator5 marksThe volume of soda in bottles produced by a certain machine is normally distributed with a mean of 330 ml and a standard deviation of 2.5 ml.
(a) Bottles are classified as 'overfilled' if their volume is between 333 ml and 336 ml. Determine the probability that a randomly selected bottle is overfilled.
(b) Approximately 75% of bottles are classified as 'standard fill', which means their volume is between ml and 333 ml.
Find the value of .
Remember to use the normal cumulative distribution function (normalcdf or equivalent) on your GDC. You need to find the area under the normal curve between the two given volumes.
You'll need to use the inverse normal function (invNorm or equivalent) on your GDC. First, calculate the cumulative probability up to . Consider the area to the left of 333 ml and subtract the given probability.
Question 2
HardPaper 1 · calculator7 marksA beverage company produces bottles of orange juice. The volume of juice in each bottle, in mL, can be modelled by a normal distribution with a mean of 1005 mL and a standard deviation of 12 mL.
Find the probability that a randomly selected bottle contains less than its labelled volume of 1000 mL.
Find the upper quartile of the volumes of the bottles.
The bottles are packed into cartons, with 8 bottles in each carton. The volumes of juice in the bottles are independent of each other.
Find the probability that the total volume of juice in a carton exceeds 8050 mL.
Recall the properties of the normal distribution. You need to find the cumulative probability for a value below the mean.
The upper quartile corresponds to the 75th percentile. Use the inverse normal function on your GDC.
When summing independent normal random variables, the mean of the sum is the sum of the means, and the variance of the sum is the sum of the variances.
Question 3
MediumPaper 1 · calculator6 marks[Maximum mark: 6]
The lifespan of a certain brand of LED light bulbs is approximated by a normal distribution with a mean of 1500 hours and a standard deviation of 120 hours.
A light bulb from this brand is chosen at random.
(a) Calculate the probability that the lifespan of the light bulb is less than 1350 hours.
It is known that 25% of the light bulbs have a lifespan greater than hours.
(b) Find the value of .
For a randomly chosen light bulb with lifespan hours, P() = 0.65.
(c) Find the value of .
Remember to use the normal cumulative distribution function (CDF) on your GDC. Make sure to input the correct mean and standard deviation.
This requires using the inverse normal function on your GDC. Be careful with whether you're using the probability for 'greater than' or 'less than'.
The given probability describes a symmetrical interval around the mean. Use this symmetry to find the cumulative probability for the upper or lower bound, then apply the inverse normal function.
Question 4
HardPaper 1 · calculator12 marksThe lifespan of a certain brand of smartphone battery is normally distributed with a mean of days and a standard deviation of days.
(a) The probability that a randomly selected battery lasts less than days is . Find the value of .
(b) A battery is randomly selected. It is known that the battery lasts longer than days. What is the probability that it lasts longer than days?
(c) A retailer orders batteries. What is the probability that at most of them have a lifespan less than days?
For a normally distributed variable with mean and standard deviation , if you are given and need to find , you should use the inverse normal function on your GDC. Remember to input the area, mean, and standard deviation correctly.
This is a conditional probability problem. Recall the formula . In this case, is the event that the battery lasts longer than days, and is the event that it lasts longer than days. Since lasting longer than days implies lasting longer than days, simplifies to .
This problem involves a large number of trials, suggesting a binomial distribution that can be approximated by a normal distribution. First, calculate the probability of a single battery having a lifespan less than days using the normal distribution. Then, use this probability to define the parameters (mean and variance) of the normal approximation to the binomial distribution. Remember to apply a continuity correction when approximating a discrete distribution with a continuous one.
Question 5
MediumPaper 1 · calculator6 marksA beverage company uses an automated machine to fill plastic bottles with water. The actual volume of water, , in a randomly chosen bottle is normally distributed with a mean of 500 mL and a standard deviation of 15 mL.
In a quality control check, if a randomly chosen bottle contains less than 485 mL of water, the company fails the check.
Find the probability that the company fails this quality control check.
A quality assurance manager suggests that a fairer check would be to pass if the mean volume of eight randomly chosen bottles is greater than 485 mL.
Find the probability of passing the quality control check if the manager's suggestion is followed.
Remember to standardize the variable using the Z-score formula or use your GDC's normal CDF function. Pay attention to whether you need P(X < x) or P(X > x).
When considering the mean of a sample, how do the mean and standard deviation of the distribution change? Recall the Central Limit Theorem for the mean of a sample.
Question 6
HardPaper 2 · calculator14 marksA manufacturer claims that the lifespan of a new batch of LED light bulbs follows a normal distribution with a mean of hours and a standard deviation of hours. To test this claim, a random sample of light bulbs was selected, and their lifespans were recorded. The observed frequencies are shown in the table below.
| Lifespan (hours) | Observed Frequency |
|---|---|
(a) Copy and complete the following table of expected frequencies, assuming the manufacturer's claim is true. Give your answers to two decimal places.
Using a distribution at the level of significance, test the hypothesis that the lifespan of the light bulbs follows a normal distribution with mean hours and standard deviation hours.
You should state the null and alternative hypotheses, clearly show your working for the statistic, and justify your conclusion.
The correct critical value may be selected from the following table, where is the value such that .
| Degrees of freedom | |
|---|---|
To find the expected frequencies, first calculate the probability for each lifespan interval using the normal distribution with the given mean and standard deviation. You will need to use the normal cumulative distribution function (CDF). Then, multiply each probability by the total number of light bulbs in the sample () to get the expected frequency.
Start by stating your null and alternative hypotheses. Then, using the observed frequencies from the question and the expected frequencies you calculated in part (a), calculate the test statistic. Remember to check if any expected frequencies are less than 5; if so, you'll need to combine categories and adjust the degrees of freedom accordingly. Finally, compare your calculated value with the critical value from the table to draw a conclusion.
Question 7
MediumPaper 1 · calculator6 marksA factory produces two types of electronic components: standard (S) and premium (P). The weight of these components is a critical characteristic for quality control.
The weights of standard components are known to be normally distributed with a mean of 150 grams and a standard deviation of 5 grams.
The weights of premium components are known to be normally distributed with a mean of 165 grams and a standard deviation of 8 grams.
A quality control machine classifies a component as 'premium' if its weight is found to be above 158 grams; otherwise, it is classified as 'standard'.
The factory's quality control manager uses the null hypothesis that, in the absence of other information, a component is standard.
Calculate the probability of making a Type I error when classifying a component.
Calculate the probability of making a Type II error when classifying a component.
It is known that 80% of the components produced are standard, and 20% are premium.
Calculate the overall probability that a randomly selected component is misclassified by the machine.
A Type I error occurs when the null hypothesis is true, but it is rejected. In this context, consider which type of component is incorrectly classified as the other.
A Type II error occurs when the null hypothesis is false, but it is not rejected. In this context, consider which type of component is incorrectly classified as the other.
Consider the total probability of error by combining the probabilities of Type I and Type II errors with the prior probabilities of each component type.
Question 8
HardPaper 2 · calculator12 marks(a) A logistics company handles two types of packages: small (S) and large (L). The weight of each type of package follows a normal distribution with parameters as shown in this table:
Type of Package
Mean weight (kg)
Standard deviation (kg)
S (Small)
L (Large)
One package of each type is selected at random. Find the probability that the large package weighs less than four times the weight of the small package.
(b) One large package and three small packages are selected at random. Find the probability that the large package weighs more than the total weight of the three small packages.
Let be the weight of a large package and be the weight of a small package. You need to find . This can be rewritten as . Consider the properties of linear combinations of independent normal random variables to find the mean and variance of .
Let be the weight of a large package and be the weights of three independent small packages. You need to find . First, find the mean and variance of the sum of the three small packages. Then, consider the difference between the large package and this sum.
Question 9
MediumPaper 1 · calculator5 marksThe weight of coffee bean packages from a certain supplier is modelled by a normal distribution with a mean of grams.
A package weighing grams is two standard deviations from the mean.
Find the standard deviation for the weight of the coffee bean packages.
It is found that of these coffee bean packages have weights between and grams, where . This interval includes packages weighing grams.
Show that the region of the normal distribution between and is not symmetrical about the mean.
Recall the relationship between a value, the mean, and the standard deviation in a normal distribution: .
Consider the properties of a symmetrical normal distribution. If the interval were symmetrical, what would be the area from the mean to ? How does this compare to the area from the mean to ?
Question 10
HardPaper 2 · calculator16 marksA factory produces specialized electronic components. The total "quality score" of a component, , is a combination of scores from three independent inspection stages:
- Stage 1: Automated visual inspection. The score from this stage has an expectation of and a standard deviation of .
- Stage 2: Manual functional test. A batch of critical functions are tested, and the score is the number of functions that pass. Each function has a probability of passing, independently.
- Stage 3: Environmental stress test. The score from this stage, representing the number of successful stress cycles, follows a Poisson distribution with a mean of .
The overall quality score for a component is given by .
Calculate the expected value and variance of the total quality score .
Given that the distribution of can be approximated by a Normal distribution, find the probability that a randomly selected component has a total quality score between and (inclusive of , exclusive of ).
The factory manager wants to ensure that the mean total quality score of a sample of components is within units of the true mean, with a probability of at least . Find the minimum sample size required.
Recall the formulas for the expectation and variance of Binomial and Poisson distributions. For independent random variables and constants , and . Remember that .
When approximating a discrete distribution with a continuous Normal distribution, remember to apply a continuity correction. For , the continuous approximation would be .
The Central Limit Theorem states that for a sufficiently large sample size , the sample mean is approximately normally distributed with mean and variance . You will need to use the inverse normal function to find the critical Z-value for the given probability.
Question 11
MediumPaper 1 · calculator7 marksA new type of LED bulb has a lifespan, , which is normally distributed with a mean of 5000 hours and a standard deviation of 300 hours.
The following curve represents this distribution. It is known that and .
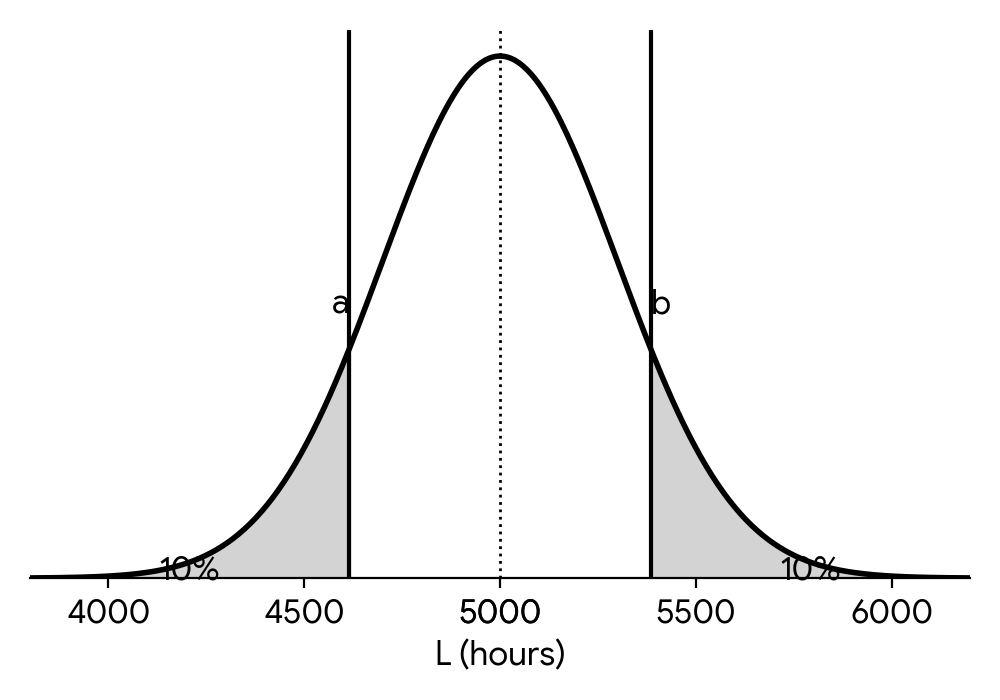
(a) Calculate the probability that a randomly selected LED bulb lasts more than 4700 hours.
(b) (i) Find the value of .
(b) (ii) Find the value of .
(c) Two LED bulbs are selected at random from a large batch. Find the probability that they both have a lifespan less than 4700 hours.
Use your GDC's normal CDF function. Remember that .
Use your GDC's inverse normal function with the given probability and distribution parameters.
Remember that implies . Use your GDC's inverse normal function.
The events are independent. You'll need the probability from your work in part (a).
Question 12
HardPaper 2 · calculator8 marksA pharmaceutical company manufactures a drug where the concentration of the active ingredient, (in mg/mL), is crucial. The concentration is influenced by the reaction time, (in minutes), during the production process.
The relationship between the concentration and the reaction time is given by .
Due to slight variations in the manufacturing process, the reaction time is normally distributed with a mean of minutes and a standard deviation of minutes. That is, .
The quality control department assigns points to each batch based on the final concentration :
| Interval (mg/mL) | Points scored |
|---|---|
| Otherwise |
Find the expected total quality points scored from batches.
First, determine the mean and standard deviation of the concentration . Then, calculate the probability of a batch falling into each scoring interval using the normal distribution. Finally, use these probabilities to find the expected points per batch and then the total expected points for all batches.
Question 13
MediumPaper 1 · calculator8 marksP1: The time, in seconds, a new automated machine takes to produce a standard component is normally distributed with a mean of seconds and a standard deviation of seconds.
(a) Find the probability that, on a randomly selected run, the machine takes longer than seconds to produce a component.
(b) Find the probability that on a randomly selected run, the machine takes between and seconds to produce a component.
(c) The factory produces components in a day.
On how many occasions should the factory expect the machine to take less than seconds to produce a component?
For a normal distribution with mean and standard deviation , the probability can be found using a GDC or by standardizing to a Z-score and using a Z-table. Remember to use the correct function for 'greater than'.
To find the probability for a normal distribution, you can use the 'normalcdf' function on your GDC with the lower bound, upper bound, mean, and standard deviation.
First, calculate the probability that a single component takes less than seconds. Then, multiply this probability by the total number of components produced to find the expected number of occasions.
Question 14
HardPaper 2 · calculator14 marksThe lifespan of a new model of LED light bulb, , is normally distributed with a mean of hours and a standard deviation of hours.
Sketch a diagram showing this information.
Find the proportion of these LED bulbs that have a lifespan between hours and hours.
A large batch of LED bulbs is purchased. Determine the expected number of bulbs in this batch that will have a lifespan of less than hours.
It is observed that of the LED bulbs last longer than hours. Estimate the value of .
Ten of these LED bulbs are chosen at random. Find the probability that exactly two of them last longer than hours.
Draw a bell-shaped curve. Label the mean at the center and indicate the standard deviation by marking points on the horizontal axis at one standard deviation away from the mean.
Use your GDC's normal CDF function. Remember to input the lower bound, upper bound, mean, and standard deviation.
First, calculate the probability that a single bulb lasts less than hours using the normal CDF. Then, multiply this probability by the total number of bulbs in the batch.
Since last longer than , this means last less than . Use the inverse normal function on your GDC with a cumulative probability of .
First, calculate the probability that a single bulb lasts longer than hours. Then, recognize that this is a binomial distribution problem with trials and the probability you just calculated as . Use the binomial probability formula or GDC function for exactly successes.
Question 15
MediumPaper 1 · calculator5 marksThe volume of liquid in bottles produced by a beverage company is normally distributed with a mean of mL and a standard deviation of mL. A bottle is considered 'underfilled' if its volume is less than mL.
(a) Find the percentage of bottles that are classified as underfilled.
Bottles are packed into crates, with each crate containing bottles.
(b) Find the probability that a random crate has at most two underfilled bottles.
For part (a), you need to calculate the Z-score for mL and then use the normal cumulative distribution function (CDF) to find the probability. Remember to convert the probability to a percentage.
For part (b), use the probability of an underfilled bottle found in part (a). This is a binomial distribution problem. Let be the number of underfilled bottles in a crate. You need to find .
Question 16
HardPaper 2 · calculator14 marksThe diameter of a certain type of industrial component is modelled by a normal distribution with a mean of mm and a standard deviation of mm.
Find the probability that a randomly selected component has a diameter less than mm.
Find the probability that a randomly selected component has a diameter greater than mm.
Assuming the diameters of components are independent, find the probability that two consecutive components both have a diameter greater than mm.
A component is classified as 'premium' if its diameter is between mm and mm. A batch of three components is considered 'high quality' if all three components in the batch are premium. Find the probability that a randomly selected batch is NOT high quality.
In a production run, batches of three components are produced. Find the probability that at least of these batches are high quality.
Find the probability that between and (exclusive of ) of these batches are high quality.
Given that at least batches are high quality, find the probability that less than batches are high quality.
Use the normal cumulative distribution function (CDF) on your GDC. Remember that is directly calculated by the CDF.
Use the normal cumulative distribution function (CDF) or the normal survival function (SF) on your GDC. Remember that .
For independent events and , the probability of both occurring is .
First, find the probability that a single component is 'premium'. Then, use this to find the probability that a batch of three is 'high quality'. Finally, calculate the complementary probability.
This scenario involves a fixed number of trials (batches), each with two possible outcomes (high quality or not), and the trials are independent. This suggests a binomial distribution. Remember .
This means finding , which is equivalent to .
This is a conditional probability problem: . Here, is 'less than batches are high quality' and is 'at least batches are high quality'. The intersection is 'between and (exclusive of ) batches are high quality'.
Question 17
MediumPaper 2 · calculator13 marksA factory produces light bulbs. The probability that a randomly selected light bulb is defective is . For a single light bulb, let the discrete random variable equal if the bulb is defective, and if it is not defective.
(a) For the random variable , write down
(i) the mean
(ii) the variance.
A quality control manager inspects a random sample of light bulbs. Let the sample mean be the proportion of defective bulbs in the sample. The Central Limit Theorem states that the distribution of can be approximated by a normal distribution for a sufficiently large .
(b) Write down the
(i) mean
(ii) variance
of , when approximated by a normal distribution.
(c) Use this normal approximation to estimate .
(d) Hence, write down for an appropriate value of , when using this normal approximation.
(e) Let be the total number of defective light bulbs in the sample.
(i) State the true distribution that satisfies.
(ii) Find the exact value of , which can be construed as the probability that more than bulbs are defective.
Recall the formula for the mean of a Bernoulli distribution. For a Bernoulli trial with probability of success , the mean is .
Recall the formula for the variance of a Bernoulli distribution. For a Bernoulli trial with probability of success , the variance is .
According to the Central Limit Theorem, the mean of the sample mean is equal to the mean of the population, .
According to the Central Limit Theorem, the variance of the sample mean is the population variance divided by the sample size, .
Use the mean and variance of found in part (b) to define the normal distribution. Then use your GDC's normalcdf function to find the probability.
The sample mean is related to the sum by . Use this relationship to find the value of . The probability will be the same as in part (c).
The sum of independent Bernoulli trials is a Binomial distribution. Identify the parameters and .
For a discrete random variable , is equivalent to . Use your GDC's binomialcdf function to calculate this probability. Remember that .
Question 18
HardPaper 2 · calculator21 marksThe lifespans, , of 250 LED light bulbs are recorded in the following table.
| Lifespan (hours) | Frequency |
|---|---|
| 20 | |
| 60 | |
| 90 | |
| 55 | |
| 25 |
This table is used to create a cumulative frequency graph.
Write down the mid-interval value of the class .
Calculate an estimate of the mean lifespan of the 250 light bulbs.
Use the cumulative frequency curve (which would be provided in an exam) to estimate the interquartile range. Assume the lower quartile () is hours and the upper quartile () is hours.
A light bulb from the data set had a lifespan of hours.
Use your answer to part (b) to estimate whether this light bulb's lifespan is an outlier for this data. Justify your answer.
It is believed that the lifespans of these LED light bulbs follow a normal distribution with mean hours and standard deviation hours.
It is decided to perform a goodness of fit test on the data to determine whether this sample of 250 light bulbs could have plausibly been drawn from an underlying distribution .
Write down the null and the alternative hypotheses for the test.
As part of the test, the following table is created.
| Lifespan of light bulb (hours) | Observed frequency | Expected frequency |
|---|---|---|
| 20 | 14.0 | |
| 60 | 60.1 | |
| 90 | a | |
| 55 | 60.1 | |
| 25 | b |
Find the value of and the value of . Give your answers to one decimal place.
Hence, perform the test to a 5% significance level, clearly stating the conclusion in context.
The mid-interval value is the average of the lower and upper bounds of the class interval.
To estimate the mean from grouped data, multiply each mid-interval value by its corresponding frequency, sum these products, and then divide by the total frequency.
The interquartile range (IQR) is the difference between the upper quartile () and the lower quartile ().
An outlier is typically defined as a value that is more than below or above . Calculate the upper bound for outliers.
The null hypothesis () usually states that there is no difference or that the data fits the proposed model. The alternative hypothesis () states that there is a difference or the data does not fit the model.
For a normal distribution , the probability can be found using the cumulative distribution function (CDF), . Then, multiply this probability by the total number of observations to get the expected frequency.
Calculate the Chi-squared test statistic using the formula . Then find the p-value using the degrees of freedom (). Compare the p-value to the significance level to draw a conclusion.
Question 19
MediumPaper 1 · calculator17 marks(a) Assume that the volume of liquid in bottles produced by a certain factory follows a normal distribution with a mean of ml and a standard deviation of ml.
Find the probability that a randomly chosen bottle contains more than ml.
(b) Find the interquartile range of the liquid volume in the bottles.
(c) Find the volume, in ml, that is exceeded by of the bottles.
(d) A quality control inspector randomly selects bottles. Find the probability that at most of them contain more than ml.
(e) In a large batch of bottles, estimate how many would contain less than ml.
For a normal distribution , the probability can be found using a GDC's normal cumulative distribution function (normalcdf) or by standardizing to a Z-score.
The interquartile range (IQR) is the difference between the upper quartile () and the lower quartile (). These can be found using the inverse normal function on your GDC.
If of the bottles exceed a certain volume, then of the bottles contain less than that volume. Use the inverse normal function.
This is a binomial distribution problem. The probability of a single bottle containing more than ml was calculated in part (a).
First, find the probability that a single bottle contains less than ml using the normal distribution. Then multiply this probability by the total number of bottles in the batch.
Question 20
HardPaper 2 · calculator25 marksThe lifespan of a new type of LED bulb, in hours, can be modelled by a normal distribution with a mean of hours and a standard deviation of hours.
A randomly selected LED bulb is chosen.
(a) Calculate the probability that its lifespan is
(i) less than hours.
(ii) between hours and hours.
(b) of LED bulbs have a lifespan of more than hours.
Calculate the value of .
A manufacturer wants to determine if a sample of LED bulbs from a new production batch could have been chosen from a normally distributed population with a mean of hours and a standard deviation of hours.
They perform a goodness of fit test at the significance level. They begin by creating the following frequency table:
| Lifespan, (hours) | Observed frequency | Expected frequency |
|---|---|---|
| a | ||
| b | ||
(c) Calculate, correct to four significant figures, the value of
(i) a.
(ii) b.
The hypotheses for the manufacturer's test are:
: The lifespans of the LED bulbs are drawn from a normally distributed population with mean hours and standard deviation hours.
: The lifespans of the LED bulbs are not drawn from a normally distributed population with mean hours and standard deviation hours.
(d) Write down the degrees of freedom for this test.
The critical value for this test is .
(e) Perform the goodness of fit test and state your conclusion, justifying your reasoning.
A competitor claims that their new 'Brand A' LED bulbs last longer on average than the manufacturer's 'Brand B' LED bulbs.
Random samples of Brand A bulbs and Brand B bulbs are chosen, and their lifespans (in hours) are measured:
Lifespans of Brand A bulbs (hours):
Lifespans of Brand B bulbs (hours):
The competitor performs a t-test at the significance level. It is assumed that the populations are normally distributed and have equal variances.
(f) Write down the null and alternative hypotheses for this test.
(g) Perform the t-test and state the conclusion, justifying your reasoning.
For a normal distribution, use the normal cumulative distribution function (normal CDF) on your GDC. Remember to input the lower bound, upper bound, mean, and standard deviation.
For the probability between two values, use the normal CDF with the given lower and upper bounds.
If of bulbs last more than hours, then of bulbs last less than or equal to hours. Use the inverse normal function on your GDC.
To find the expected frequency for a category, calculate the probability of a bulb's lifespan falling into that category using the normal distribution, then multiply by the total sample size (). For 'a', calculate .
For 'b', calculate . Alternatively, if you have calculated 'a' and the other expected frequencies, you can subtract them from the total sample size ().
The degrees of freedom for a goodness of fit test are calculated as (number of categories - 1 - number of parameters estimated from the sample). In this case, the mean and standard deviation are given, not estimated.
Use your GDC to perform the GOF test. Compare the p-value to the significance level or the statistic to the critical value.
The null hypothesis () always states that there is no difference or no effect. The alternative hypothesis () reflects the claim being tested, which is that Brand A bulbs last longer on average.
Use your GDC's two-sample t-test function. Ensure you select 'pooled' for equal variances and the correct alternative hypothesis (one-tailed). Compare the p-value to the significance level.
No question on this page matches those filters. Try another difficulty or paper.
22 more Normal distribution + bell curve (+inv normal) questions in the app
Every answer is marked mark by mark, IB-style, and the AI tutor helps when you are stuck.
Where marks are lost
- Using your own wrong value after failing a "show that." All follow through is withdrawn for the rest of that question.
