Limits & derivative definition, increasing / decreasing functions: notes and practice questions
- Calculus: branch of mathematics dealing with rates of change.
- Limits: value a function approaches as approaches a particular value.
- The Derivative ( or ): function relating curve gradient to , calculates exact rate of change.
- Tangent: straight line touching graph at one point . Gradient of function at equals gradient of tangent at .
- Gradient of tangent at is the limit of chord gradients connecting to as .
- Increasing function: output increases as increases, .
- Decreasing function: output decreases as increases, .
- Stationary point: gradient is zero, .
- Power Rule for Differentiation:
- If , then .
- If , then .
- Derivative of a linear term is .
- Derivative of any constant is .
- To differentiate sums/differences:
- Rewrite all terms as powers of (e.g., roots as fractional powers, in denominator as negative powers, expand brackets).
- Apply power rule to each term.
- To find increasing intervals: solve .
- To find decreasing intervals: solve .
- To find stationary points: solve .
- GDC: Estimate limits using trace/table; evaluate derivatives at a point using .
- Do not differentiate products or quotients directly using the power rule; expand expressions first.
- Differentiation is applied to optimisation problems (maximising/minimising) by setting the derivative to zero.
How it is examined
The excluded content is what matters. AI never asks for a limit algebraically and never asks for differentiation from first principles, which is a real split from AA. What it does ask for is interpretation: what means in this context, and what its units are. Units on a rate of change are a recurring mark. Usually one part of a longer differentiation question: find , solve , then state the interval where the function increases. Interval notation is where marks go, particularly whether endpoints are included and whether the domain of the model restricts the answer.
- An introduction to the concept of a limit.
- The derivative interpreted as a gradient function and as a rate of change.
- Increasing and decreasing functions.
- The graphical interpretation of , and .
Not required: formal analytic methods of calculating limits. So no algebraic limit manipulation, and no differentiation from first principles.
Linking questions
- Links to other subjects: marginal cost, marginal revenue, marginal profit, market structures (economics); kinematics, induced emf and simple harmonic motion (physics); interpreting the gradient of a curve (chemistry).
- Aim 8: the debate over whether Newton or Leibniz discovered certain calculus concepts, and how the Greeks' distrust of zero meant that Archimedes' work did not lead to calculus.
- International-mindedness: attempts by Indian mathematicians (500-1000 CE) to explain division by zero.
- TOK: what value does the knowledge of limits have? Is infinitesimal behaviour applicable to real life? Is intuition a valid way of knowing in mathematics?
- Use of technology: spreadsheets, dynamic graphing software and the GDC should be used to explore ideas of limits, numerically and graphically. Hypotheses can be formed and then tested using technology.
- The guide lists no connections for SL 5.2.
Practice questions
37 questions · 27 medium · 10 hardQuestion 1
MediumPaper 1 · calculator6 marksIf someone said that the green area in a city was said to be changing at a rate of
where A is taken as the green area in and is the time in years since 2000.
Determine according to this model whether there would be an increase or decrease in the green area during 2010.
Determine the expression of if the green area was considered to be 765 during 2010.
The sign of the rate of a variable determines whether its increasing (if positive rate) or decreasing (If negative rate).
To reach a function from its derivative you need to integrate and be careful to the constant c.
Question 2
HardPaper 1 · calculator8 marksA botanical garden features a winding path for visitors. The path can be modelled by the function . All distances in the garden are in kilometres.
A new straight maintenance path needs to be constructed. This path will start at point P on the visitor path, which has coordinates .
(a) Using your graphic display calculator, find the value of .
(b) Find the equation of the line normal to at point P.
(c) The maintenance path connects point P to another point Q on the visitor path, where the normal line intersects the path again. For safety regulations, point Q must have a positive x-coordinate. Determine the length of this new maintenance path.
Remember how to use the derivative function on your GDC for a specific point. You are looking for the gradient of the tangent at .
The gradient of the normal line is the negative reciprocal of the gradient of the tangent line at that point. Use the point-gradient form of a straight line equation.
First, find the coordinates of point Q by setting the equation of the normal line equal to the function and solving for using your GDC. Remember that P is one of the intersection points. Then, use the distance formula between P and Q.
Question 3
MediumPaper 1 · calculator5 marksThe diagram shows the slope field for the differential equation for and .
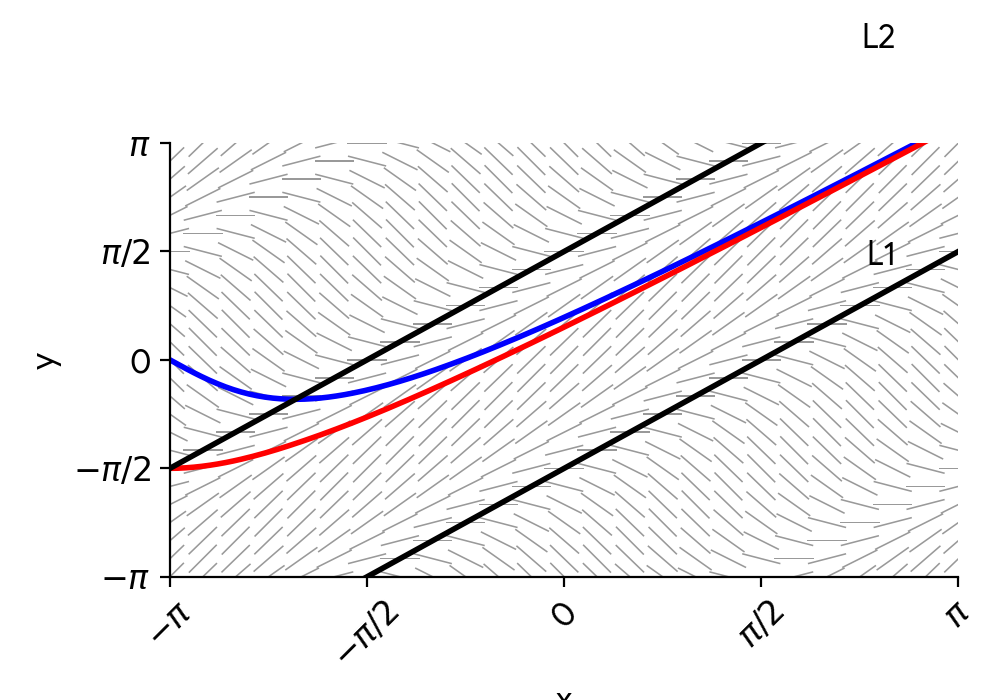
The local maximum points for solutions to the differential equation lie on the straight line .
Find the equation of , giving your answer in the form .
Find the equation of the straight line on which all local minimum points lie within the given domain, giving your answer in the form .
To find local maximum points, you need to find where and then use the second derivative test or analyze the sign change of . Remember to consider the domain for and .
Similar to part (a), but consider the condition for local minimum points. What must be the sign of the second derivative?
Question 4
HardPaper 1 · calculator10 marksThe concentration of a reactant A, in mg/L, in a chemical reaction over time (in minutes) is modelled by the function:
, for .
(a) Find the coordinates of the local minimum point of the concentration.
(b) Find the coordinates of the local maximum point of the concentration.
(c) Find the set of values of for which the concentration of reactant A is above mg/L.
To find local minimum points, you need to find the first derivative of the function, set it to zero to find critical points, and then use the second derivative test or analyze the sign change of the first derivative to classify them.
Refer to the critical points found in part (a). Use the second derivative test to determine which critical point corresponds to a local maximum.
Set up an inequality . Simplify the inequality and factorize the resulting cubic expression. Then, consider the sign of the cubic function within the given domain.
Question 5
MediumPaper 1 · calculator8 marksA high-speed drone is being tested, and its acceleration, , is modelled by the function , where is the speed of the drone in m/s and is the time in seconds, for seconds.
Determine whether the speed of the drone is increasing or decreasing at seconds.
It is observed that when seconds, the speed of the drone is m/s.
Find an expression for the function .
Recall that the sign of the derivative tells you whether the original function is increasing or decreasing. If , the speed is increasing. If , the speed is decreasing.
To find the original function from its derivative , you need to integrate. Remember to include the constant of integration, and use the given initial condition to find its value.
Question 6
HardPaper 1 · calculator7 marks(a) When the profit is zero, find the possible number of units produced, .
(b) Determine the positive values of profit, , for which there is only one positive value of (units produced).
To find the values of when the profit is zero, you need to solve the equation . You can factor out first.
Consider the graph of the profit function . To find where there is only one positive value of for a given , you need to analyze the local maximum and minimum points of the function. First, find the derivative and set it to zero to find the critical points.
Question 7
MediumPaper 1 · calculator7 marksA chemical reaction is monitored in a laboratory. The concentration of a specific compound, C, in milligrams per litre (mg/L), changes over time, t, in minutes.
The rate of change of the compound's concentration is modelled by
At 8 minutes, the concentration of the compound is 70 mg/L.
Find an expression for C in terms of t.
The experiment continues for an extended period.
Describe how the compound's concentration changes if the time elapsed is between 25 minutes and 35 minutes. Justify your answer.
To find the expression for C(t) from its rate of change, you need to integrate the given derivative. Remember to include a constant of integration and use the provided initial condition to find its value.
Consider the sign of the rate of change of concentration, , in the given time interval. If the rate is negative, the concentration is decreasing.
Question 8
HardPaper 2 · calculator14 marks(a) An architect is designing a decorative archway for a park entrance. The cross-section of one half of the archway is modeled. The archway is symmetrical about the y-axis.
The architect models the base section of the archway as a straight line passing through the points and , where all units are in metres.
Find the equation of the line passing through these two points.
(b) The architect initially models the curved upper section of the archway using the following measured points:
, , , and .
(i) Find the equation of the least squares regression quadratic curve for these four points.
(ii) By considering the gradient of this curve when , explain why it may not be a good model for the archway.
(c) The architect decides that a better model for the curved section would be a quadratic curve with a maximum point at and that passes through the endpoint .
Find the equation of this new quadratic model.
(d) Believing this to be a better model for the archway, the architect wants to estimate the volume of the solid generated by rotating this half-archway about the x-axis.
(i) Write down an expression for this estimate of the volume as a sum of two integrals.
(ii) Find the value of this estimate.
Recall the formula for the gradient of a straight line given two points, and then use the point-slope form or slope-intercept form to find the equation of the line.
Use a graphing display calculator (GDC) to perform a quadratic regression on the given data points. Ensure your calculator is set to the appropriate regression type.
Calculate the gradient of the straight line from part (a) at and the gradient of the quadratic curve from part (b.i) at . Compare these values to assess the smoothness of the transition.
Use the vertex form of a quadratic equation, , where is the maximum point. Substitute the maximum point and the given endpoint to solve for the constant .
The volume of revolution about the x-axis is given by . You need to set up two integrals, one for the straight line segment and one for the quadratic curve, with their respective limits.
Evaluate the integrals from part (d.i) using your GDC. Remember to multiply by .
Question 9
MediumPaper 1 · calculator6 marksThe rate of change of the volume of water in a reservoir, in thousands of cubic meters per year, is given by the equation:
where is the volume of water in thousands of cubic meters and is the time in years since the start of monitoring.
(a) Determine whether the volume of water in the reservoir is increasing or decreasing when years.
(b) One year after the start of monitoring, the volume of water in the reservoir was 5 thousand cubic meters. Find an expression for , the volume of water in the reservoir at time , for .
To determine if the volume is increasing or decreasing, you need to evaluate the sign of the rate of change at the given time.
To find the expression for , you need to integrate the given rate function. Remember to include the constant of integration and use the given condition to find its value.
Question 10
HardPaper 2 · calculator13 marksA company models the growth of its user base, , and its server capacity, , over time (in months) using the functions:
where and are in thousands of users.
(a) Solve .
(b) (i) Write down the integral that represents the area of the region enclosed between the graphs of and .
(ii) Calculate the area of this region.
(c) At a certain time , the rate of change of the user base is equal to the rate of change of the server capacity. Find the value of .
Use a graphing display calculator (GDC) to plot both functions and find the points of intersection. Remember to set the window appropriately to see all intersection points.
The area between two curves and from to is given by . Determine which function is above the other in the interval of interest.
Use the definite integral function on your GDC with the integral you wrote down in part (b)(i).
The rate of change of a function is given by its derivative. Find the derivatives of and and then set them equal to each other to solve for . You may need your GDC to solve the resulting equation.
Question 11
MediumPaper 1 · calculator7 marksA company is designing a new cylindrical storage tank. The cost of manufacturing, in thousands of dollars, is modelled by the function , where is the radius of the tank in metres, and .
(a) Write down the equation of the vertical asymptote of .
(b) Find .
(c) Determine the interval in which is decreasing.
Consider the values of for which the function would become undefined or approach infinity.
Recall the power rule for differentiation. Rewrite as before differentiating.
To find where the function is decreasing, you need to find where its derivative, , is negative. Start by finding the critical points where .
Question 12
HardPaper 2 · calculator17 marksEmily and Liam are researching the adoption of smart home devices in a specific region to create a model predicting future usage. They collect the following data:
| Year | Years after 2000 () | Number of devices (in thousands) () |
|---|---|---|
| 2000 | 0 | 10 |
| 2005 | 5 | 150 |
| 2010 | 10 | 400 |
| 2015 | 15 | 750 |
| 2020 | 20 | 1000 |
| 2025 | 25 | 1100 |
Emily proposes the number of devices can be modelled using quadratic regression to find a function of the form , where is the number of years after 2000.
Find the equation of Emily's model.
Emily finds the coefficient of determination for her model is to five significant figures.
State whether the coefficient of determination supports Emily's proposal. Justify your answer.
Comment on the validity of Emily's model with reference to one of the parameters in the equation.
(i) Find the value of and interpret this value in context.
(ii) By considering the changes in device adoption in the table, use the value found in part (d)(i) to comment on the validity of Emily's model.
Liam proposes that the device adoption instead follows a logistic model of the form
where is the number of years after 2000 and is the number of devices in thousands.
State a reason why it may be valid to use Liam's proposal to predict future device adoption.
(i) Find .
(ii) Hence find the year, according to Liam's model, during which the greatest device adoption growth rate occurred.
Use your GDC's regression features (e.g., QuadraticReg) to find the coefficients , , and . Ensure you input the 'Years after 2000' as your -values and 'Number of devices (in thousands)' as your -values.
Recall what a coefficient of determination () value close to 1 indicates about the model's fit to the data.
Consider the real-world implications of the values of or in the context of device adoption. Can the number of devices be negative, or can it decrease indefinitely?
For (i), differentiate with respect to to find , then substitute . The derivative represents the rate of change. For (ii), compare the model's predicted rate of change with the actual data in the table, especially for the period around .
Think about the long-term behaviour of logistic models, especially in the context of growth phenomena like technology adoption.
For (i), use the chain rule or quotient rule to differentiate . Remember that . For (ii), the maximum growth rate for a logistic function occurs when , where is the coefficient of in the denominator.
Question 13
MediumPaper 1 · calculator6 marksA company's daily production cost, , in thousands of dollars, for producing units of a specialized component, is modelled by the function , for .
Write down the equation of the vertical asymptote of .
Find , the marginal cost function.
Determine the interval for where the production cost is increasing.
Consider the values of for which the function becomes undefined.
Recall the power rule for differentiation: . Remember that .
The function is increasing when its derivative is positive. Set and solve for . Remember the domain .
Question 14
HardPaper 2 · calculator18 marksThe rate of change of pollution, (in tonnes per day), in a protected lake is modelled by , where is the time in days since monitoring began, for .
(i) Find the value of at days.
(ii) Interpret the meaning of your answer to part (a) (i) in context.
Use to find the value of when the pollution in the lake reaches its maximum level.
Two days after monitoring began, the pollution in the lake was tonnes.
Find an expression for in terms of , for .
Hence, find the maximum pollution level in the lake.
A second source of pollution, from a nearby factory, is modelled by , where is the pollution in tonnes and is the time in days, for .
Write down the initial pollution from this factory.
Each day, the pollution from the factory increases by %.
Find the value of .
Find the value of when the pollution from the initial lake source and the factory are the same.
Substitute the given value of into the expression for .
Consider what represents and what the positive value signifies.
The maximum level of pollution occurs when its rate of change is zero.
Integrate the expression for to find . Use the given condition to find the constant of integration.
Substitute the value of found in part (b) into the expression for found in part (c).
The initial pollution occurs at .
For an exponential growth model , the growth factor is . The percentage increase is .
Set the expressions for and equal to each other and solve using your GDC.
Question 15
MediumPaper 1 · calculator9 marksA spherical ice sculpture is melting in a gallery. Initially, the sculpture has a radius of 30 cm. This information is illustrated in the following diagram.
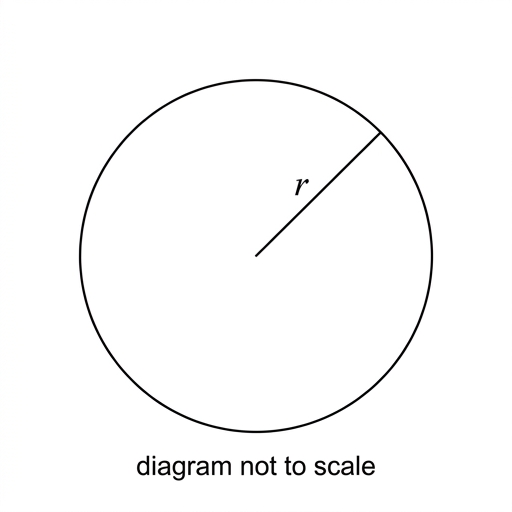
The gallery curator predicts that, as the ice sculpture melts, its radius will decrease at a constant rate of 0.5 cm per hour.
According to this model, find
(i) the radius of the ice sculpture, 10 hours after it begins melting.
(ii) the volume of the ice sculpture, 10 hours after it begins melting. Give your answer to one decimal place.
Let the function represent the volume of the ice sculpture, , hours after it begins melting. is given by
, for .
Find .
Find the rate of change of the volume of the ice sculpture at hours.
State one reason why the radius of the ice sculpture may not always decrease at a constant rate.
To find the new radius, subtract the total decrease in radius from the initial radius. The total decrease is the rate of decrease multiplied by the time elapsed.
Recall the formula for the volume of a sphere: . Use the radius calculated in part (a.i).
Apply the power rule for differentiation to each term of the polynomial function.
The rate of change of volume is given by the derivative . Substitute into your expression for from part (b).
Consider real-world factors that might influence the melting process of an ice sculpture, such as environmental conditions or the sculpture's changing shape.
Question 16
HardPaper 3 · calculator26 marksA chemical spill has contaminated a section of a river. Environmental engineers are monitoring the concentration of a particular pollutant. Let , measured in milligrams per litre (mgL), be the concentration of the pollutant, days after a new batch of pollutant is introduced. The rate at which the pollutant naturally degrades or is flushed away is modelled as directly proportional to its concentration, leading to the differential equation
, where .
The initial concentration is mgL, .
By solving the differential equation, show that .
For the remainder of this question, you will consider this pollutant where it is known that . The first significant spill occurs at time and it is assumed that before this there is no pollutant present in the river.
Find the time, in days, for this pollutant to reach 10% of its initial concentration.
The pollutant is added to the river every days due to regular discharges, and in constant amounts, such that the concentration of the pollutant is increased by an amount mgL. To simplify the model, it is assumed that each time the pollutant is added, the concentration in the river increases instantaneously.
Show that the concentration of the pollutant is immediately after the third discharge is given.
Immediately after the discharge is given, the concentration of the pollutant is
.
Show that this concentration can be expressed as .
After the river has been subjected to these discharges for a long time, it is required to keep the pollutant concentration within a particular range to ensure ecological safety.
Let be the highest concentration of the pollutant in the river for the interval .
Let be the lowest concentration of the pollutant in the river for the interval .
This is shown in the following graph.
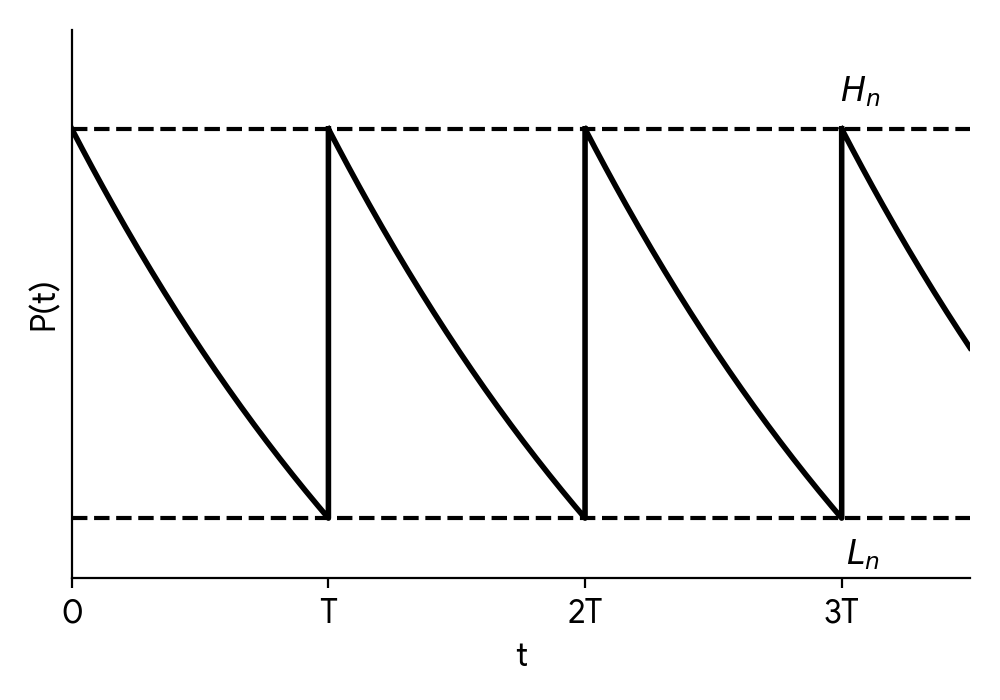
is defined as and is defined as .
Find, in terms of and , an expression for
.
.
Show that
.
.
It is known that this pollutant is considered safe if the long-term concentration never exceeds and ecologically effective if it never drops below .
Hence, for this pollutant, find a suitable value for
.
.
For the values of and found in part (g), find the proportion of time for which the concentration of the pollutant is at least between the first and second discharges.
Suggest a reason why the environmental regulations might specify a different value for to that found in part (g)(ii).
To solve the differential equation, separate the variables and . Integrate both sides and use the initial condition to find the constant of integration.
Set and solve for using the given value of .
Consider the contribution of each discharge to the total concentration immediately after the third discharge. The first discharge has decayed for hours, the second for hours, and the third has just been added.
Recognize the sum as a geometric series. Identify the first term, common ratio, and number of terms.
As , the term approaches 0. Use the formula from part (d) and consider the limit.
The lowest concentration in an interval occurs just before a new discharge. This is the highest concentration after it has decayed for one period .
Substitute the expressions for and found in part (e) and simplify.
Use the relationship or substitute the expressions for and directly into the logarithmic expression.
To satisfy both conditions, set and . Use the relationship .
Use the relationship with the values from part (g)(i) and .
The concentration starts at after the first discharge. Find the time when the concentration drops to within the interval . The proportion is .
Consider practical implications of the calculated value of for scheduling regular discharges or monitoring.
Question 17
MediumPaper 1 · calculator8 marksThe rate of profit, , in thousands of dollars per month, for a new product is modelled by the piecewise function
where and . For a smooth transition in the profit rate, it is required that .
Find the value of .
Show that .
The total profit from the product at time is zero.
Find the time when the total profit returns to its initial position.
To find the value of T where the two functions meet, set equal to and solve for T.
First, find the derivatives of and . Then, substitute the value of found in part (a) into both derivatives to show they are equal.
The total profit is the integral of the profit rate. Set the sum of the definite integrals over the two phases (from 0 to T, and from T to k) equal to zero, where k is the time when the total profit returns to zero.
Question 18
HardPaper 3 · calculator28 marksA small scientific probe is launched into a dense liquid to collect data. Its descent is affected by gravity, buoyancy, and liquid resistance. The direction downwards is taken to be positive.
Initially, a simple model for the probe's velocity, ms, at time seconds, assumes constant effective acceleration due to gravity and buoyancy, ms, given by:
When the probe enters the liquid at m, its initial velocity is ms. The displacement from its initial position is metres.
(i) Use the chain rule to show that .
(ii) Assuming that is a constant, solve the differential equation to find as a function of .
(iii) Using ms, determine whether the model predicts that the probe will reach a velocity of ms at some point before it reaches a depth of m. Justify your answer.
To test the model , the probe conducted a trial descent, and data for against was recorded.
(i) If the model is correct, describe the shape of the graph of against .
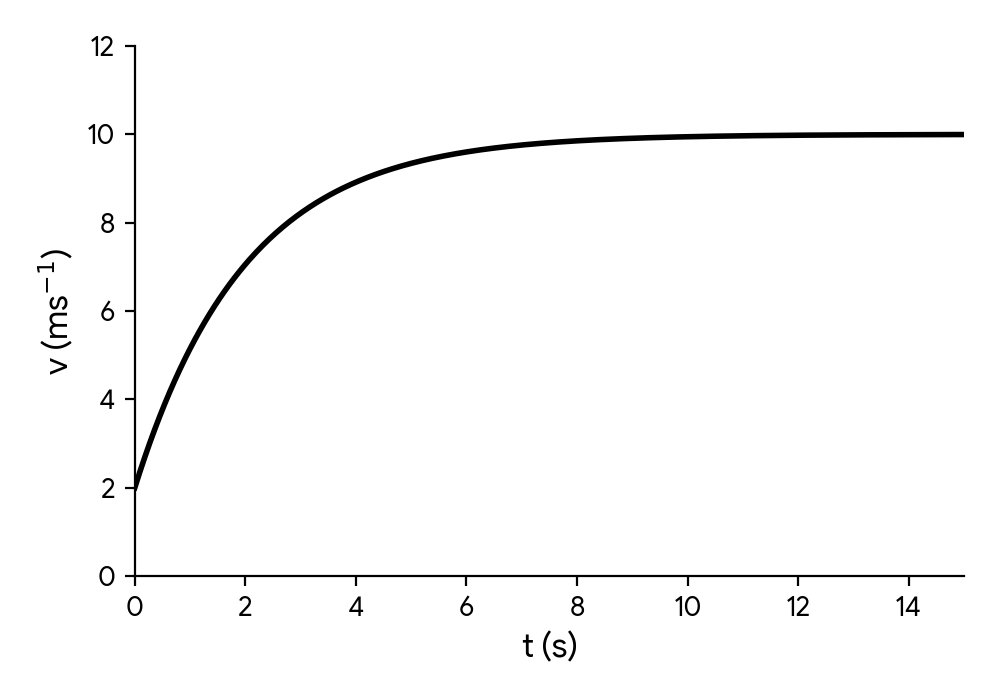
(ii) The observed data showed a graph where the velocity increased rapidly at first, then its rate of increase slowed down, eventually approaching a constant value. Use this observation to comment on the validity of the model in part (a).
An improved model considers liquid resistance, using
where is a positive constant. You are reminded that initially and . You may assume that .
(i) By using , solve the differential equation to find in terms of , and .
The probe's engineers use the graph of against from the trial descent to estimate the value of .
(ii) The gradient is estimated to be ms when ms. Taking to be ms, use this information to show that the engineers found that .
(iii) Hence, find the value of predicted by this model, as tends to infinity.
(iv) Find the upper bound for the velocity according to this model, given that . Give your answer to four significant figures.
(d) A more refined model for the probe's descent suggests that the rate of change of velocity with respect to displacement is given by . Use Euler's method with a step length of m to estimate the value of when m. Take the initial velocity ms at m.
(i) Suggest one improvement to the use of Euler's method which might increase the accuracy of the prediction of the model.
(ii) Suggest one factor not explicitly considered by the model in part (d) which might lead to a difference between the model's prediction and the data collected.
Recall the chain rule for derivatives involving an intermediate variable. In this case, is a function of , and is also a function of . You also know the relationship between velocity and displacement.
Separate the variables and , then integrate both sides. Remember to use the initial conditions () to find the constant of integration.
Substitute and into your equation from part (a)(ii) to find the displacement at which this velocity is reached. Then compare this value with m.
Consider what kind of function would result from integrating .
Compare the observed behavior (rate of increase slowing down) with the prediction of the simple model (constant rate of increase).
Substitute into the given differential equation. Then, separate variables and integrate using a substitution method (e.g., ). Finally, apply the initial conditions to solve for the constant of integration.
Substitute the given values for , , and into the improved model's differential equation and solve for .
Consider what happens to the exponential term as . Alternatively, recall that terminal velocity occurs when .
Since velocity is an increasing function of depth, the upper bound will occur at the maximum depth, m. Substitute this value into your equation from part (c)(i).
Euler's method for is . Perform the calculations step-by-step until reaches m.
Consider factors that affect the accuracy of numerical methods for solving differential equations.
Think about real-world conditions that could affect a probe's descent in liquid that are not included in the mathematical model.
Question 19
MediumPaper 1 · calculator7 marksThe concentration, , of a certain chemical in a solution, measured in milligrams per litre (mg/L), hours after a reaction begins, is modelled by the function , where is a constant.
The rate of change of the concentration at hours is mg/L per hour.
Determine the value of .
Show that the concentration of the chemical is decreasing at hours.
First, find the derivative of the concentration function, , with respect to time . Then, substitute the given values for and into the derivative to solve for the constant . Remember the power rule for differentiation.
To show if the concentration is decreasing, you need to evaluate the rate of change of concentration, , at hours using the value of found in part (a). If , then the concentration is decreasing.
Question 20
HardPaper 3 · calculator29 marksIn this question, marine biologists are studying the population dynamics of a rare species of "Azurefin" fish in a newly established protected reef area.
Historically, the Azurefin population in this region maintained a stable size of individuals. Following a period of environmental disturbance, the population was reduced to fish. At this point, the area was designated a protected marine reserve, and conservation efforts began, leading to a recovery in the fish population.
Researchers wish to model the size of the Azurefin population, , as a function of , where is the time, in years, since the establishment of the protected reserve.
Initially, the researchers consider using the logistic model:
, where .
The researchers decide to set .
State the assumption being made by setting .
At , the population of Azurefin fish is .
Find the value of .
At years, the population of Azurefin fish is found to have increased to .
Find the value of . Give your answer correct to three significant figures.
Use your model to predict the size of the Azurefin population in the area years after it became protected. Give your answer correct to the nearest whole number.
An alternative model for population growth is called the Gompertz model. When applied by the researchers to the Azurefin population, this model satisfies the differential equation:
, .
Write down the value of when .
Interpret your answer to part (b)(i) in context.
Consider the function , where .
Show that .
Hence, use separation of variables to show that the general solution of
, where ,
can be written as
,
where is an arbitrary positive constant.
Use the size of the Azurefin population at to find the value of .
Give your answer in the form , where .
Use the size of the Azurefin population at , given in part (a), to show that , correct to three significant figures.
Use the Gompertz model to predict the size of the Azurefin population at . Give your answer correct to the nearest whole number.
After years, the Azurefin population is measured and is found to be .
Comment on the predictions made by the two models.
By tracking individual Azurefin fish, the researchers find that about of the population migrates out of the protected area each year.
They decide to adapt the Gompertz model to allow for this. The new model will satisfy the differential equation:
.
Use Euler's method, with a step size of years and an initial value of when , to find an estimate for the size of the Azurefin population when .
Give your answer correct to the nearest whole number.
Comment on your answer.
Consider what the parameter represents in the context of a logistic growth model for a population.
Substitute the given initial conditions ( and ) into the logistic model equation.
Substitute the known values of , , , and into the logistic model equation and solve for . Remember to use the value of found in the previous part.
Substitute and the values of , , and into the logistic model equation.
Substitute into the given differential equation and evaluate.
Consider what a zero rate of change means for a population that is at its carrying capacity.
Use the chain rule for differentiation. Remember that .
Rearrange the differential equation to separate and terms. Use the result from part (b)(iii) for the integral of the term. Remember to introduce a constant of integration.
Substitute and into the general solution and solve for .
Substitute , , and the value of found in the previous part into the general solution and solve for .
Substitute and the values of , , and into the Gompertz model solution . Then solve for .
Compare the actual measured value () with the predictions from the logistic model (part a.iv) and the Gompertz model (part b.vii).
Euler's method uses the formula . You will need to apply this iteratively from to with a step size of . The function is given by the differential equation.
Compare the Euler's method prediction to the actual measured population at and the predictions from the other models.
No question on this page matches those filters. Try another difficulty or paper.
17 more Limits & derivative definition, increasing / decreasing functions questions in the app
Every answer is marked mark by mark, IB-style, and the AI tutor helps when you are stuck.
Where marks are lost
- Using your own wrong value after failing a "show that." All follow through is withdrawn for the rest of that question.
- Leaving an answer in calculator notation. Never accepted in a final answer, and AI's constant calculator use makes this the easiest slip in the whole subject.
