Sketching graphs: notes and practice questions
- Sketch: Produce a rough graph outline, clearly label all key points (intercepts, minimums/maximums, asymptotes).
- Draw: Produce an accurate graph on a scaled grid, plot specific points from GDC, join with a straight line or smooth curve.
- Domain: Set of valid input values (x-coordinates).
- Range: Set of valid output values (y-coordinates).
- Common Number Sets: (Real), (Integers), (Natural, 0, 1, 2...), (Rational).
- y-intercept: Where graph crosses y-axis ().
- x-intercept(s): Where graph crosses x-axis (), also roots or zeros.
- Turning points: Local minimums or maximums, where the gradient changes direction.
- Vertex: The single absolute minimum or maximum point of a quadratic graph.
- Asymptotes: Straight lines a graph approaches infinitely closely but does not cross (horizontal or vertical).
- Quadratic Models ():
- -shaped (minimum point).
- -shaped (maximum point).
- Axis of symmetry:
- The x-coordinate of the vertex lies on the axis of symmetry.
- Cubic Models ():
- overall trend from bottom-left to top-right.
- overall trend from top-left to bottom-right.
- Can have 1, 2, or 3 roots; 0 or 2 turning points.
- Exponential Models ( or ):
- Horizontal asymptote:
- y-intercept:
- curve stays above asymptote; curve stays below.
- Sinusoidal Models ( or ):
- Principal axis:
- Amplitude: (Max value: , Min value: ).
- Period (in degrees):
- **Solving graphically:** Plot and on GDC, use intersect tool for x-coordinates of solutions.
- **Solving graphically:** Plot and horizontal line , find intersections.
- Always sketch GDC output on paper to secure method marks.
- Adjust GDC viewing window (X-min/max, Y-min/max) to match the context.
- Manually plot asymptote lines (e.g., ) on GDC to visually verify.
- Use GDC built-in analysis tools (Zero/Root, Minimum, Maximum, Intersect, Value) for exact coordinates; avoid "eyeballing."
- To solve simultaneous linear equations graphically, rearrange both equations to form, then use GDC intersect.
How it is examined
"Transferring a graph from screen to paper" is literally what the student does: graph it on the GDC, then reproduce it with axes and features labelled. Marks are awarded for the shape, for the labelled intercepts and asymptotes, and for the domain being respected, so a correct curve with unlabelled axes drops marks.
- The graph of a function and its equation .
- Creating a sketch from information given or from a context, including transferring a graph from screen to paper.
- Using technology to graph functions, including their sums and differences.
Linking questions
- Links to other subjects: sketching and interpreting graphs (sciences, geography, economics).
- TOK: does studying the graph of a function carry the same mathematical rigour as studying it algebraically? What are the advantages and disadvantages of having different forms and symbolic languages in mathematics?
Practice questions
50 questions · 42 medium · 8 hardQuestion 1
MediumPaper 1 · calculator7 marks(a) The intensity of light, I, from a lighthouse varies inversely with the square of the distance, d, from the lighthouse, where .
It is known that at a distance of 2 metres from the lighthouse, the light intensity is 50 candelas per square metre (cd m).
Show that .
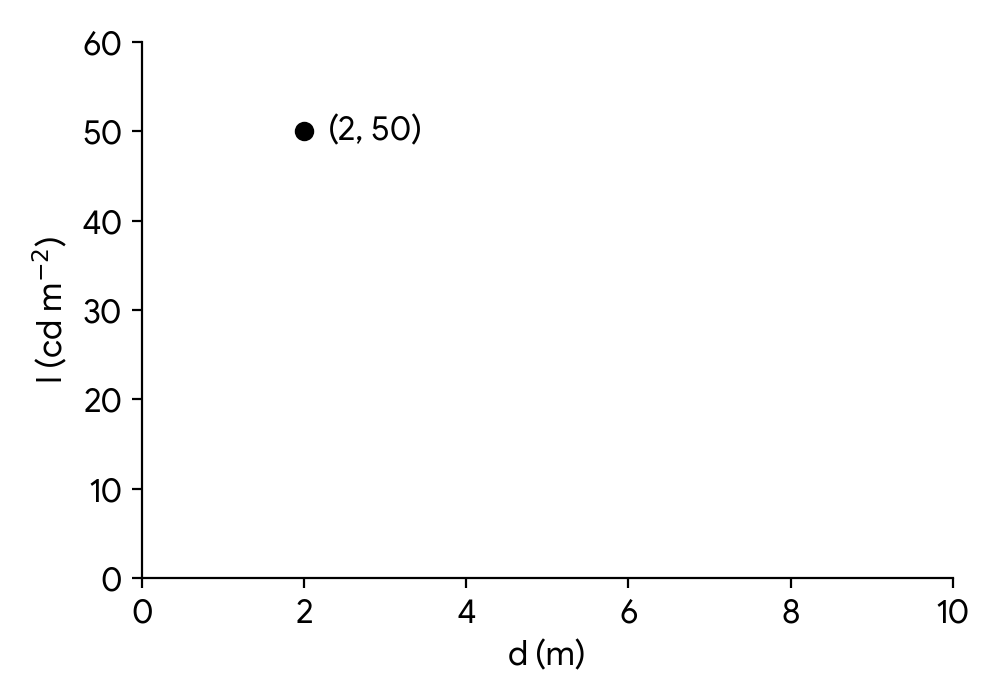
(b) Sketch the curve of I on the axes below, showing clearly the point (2, 50).
(c) A small boat needs a light intensity greater than to navigate safely.
Find the values of d where the boat cannot navigate safely.
Recall the definition of inverse variation. Set up the general formula and use the given point to find the constant of proportionality.
Consider the general shape of an inverse square function. What happens to I as d gets very large? What about as d approaches 0? Make sure to label the given point.
Set up an inequality where the light intensity is less than or equal to the minimum required intensity. Remember that distance d must be positive.
Question 2
HardPaper 2 · calculator22 marksThe concentration of a certain chemical, , in a solution over a period of time can be modelled using the function , where is the time in hours after the experiment begins.
Sketch the graph of for .
Find the concentration after hours.
Find the concentration after hours.
Find the maximum concentration and the time in hours at which this occurs.
Find the minimum concentration and the time in hours at which this occurs.
Find the times in hours when the concentration is mol/L.
Use your GDC to plot the function. Ensure your graph shows the correct domain and key features like intercepts and turning points.
Substitute into the given function .
Substitute into the given function .
To find the maximum concentration, you need to find the derivative of , set it to zero, and solve for . Then, evaluate at these critical points and the endpoints of the domain. Alternatively, use the 'maximum' function on your GDC.
Consider the values of at the critical points found in part (d) and at the endpoints of the domain ( and ). Alternatively, use the 'minimum' function on your GDC.
Set and solve the resulting cubic equation for . Use your GDC's solver or intersection feature.
Question 3
MediumPaper 1 · calculator4 marksThe graph of represents the concentration of a certain chemical in a solution (in mol/L) at time (in hours). The graph passes through the points and , and has a horizontal asymptote at .
Let represent the concentration in a different experiment.
Find .
On a new set of axes, sketch the graph of , clearly indicating its horizontal asymptote and the -intercept. You do not need to show the graph of .
Recall how transformations affect the input and output values of a function. For , evaluate at the required value, then apply the vertical stretch and vertical shift .
Consider how each transformation (, , ) affects the horizontal asymptote and the points on the original graph. The horizontal asymptote transforms to . The point on transforms to on .
Question 4
HardPaper 2 · calculator14 marksA drone launches a package, and its trajectory is modelled by the equation , where is the height of the package in metres and is the horizontal distance in metres from the launch point.
On paper, sketch the graph of the path that the package flies for . Clearly indicate the initial height, the maximum height, and the horizontal distance when it lands.
Find the height of the package when it has travelled a horizontal distance of metres.
Find the maximum height of the package.
Find the horizontal distance at which the package lands on the ground, and explain what this value represents in the context of the problem.
Identify the initial height (when ), the maximum height (vertex), and the point where the package lands (where ). Remember the general shape of a quadratic function with a negative leading coefficient.
Substitute the given horizontal distance into the function .
The maximum height of a quadratic function occurs at the vertex, where . Once you find this -value, substitute it back into the function to find the maximum height.
The package lands on the ground when its height is zero. Set and solve the quadratic equation for . Remember that horizontal distance must be positive.
Question 5
MediumPaper 1 · calculator9 marks[Maximum mark: 9]
Consider the function , . The graph of for is shown on the following axes.
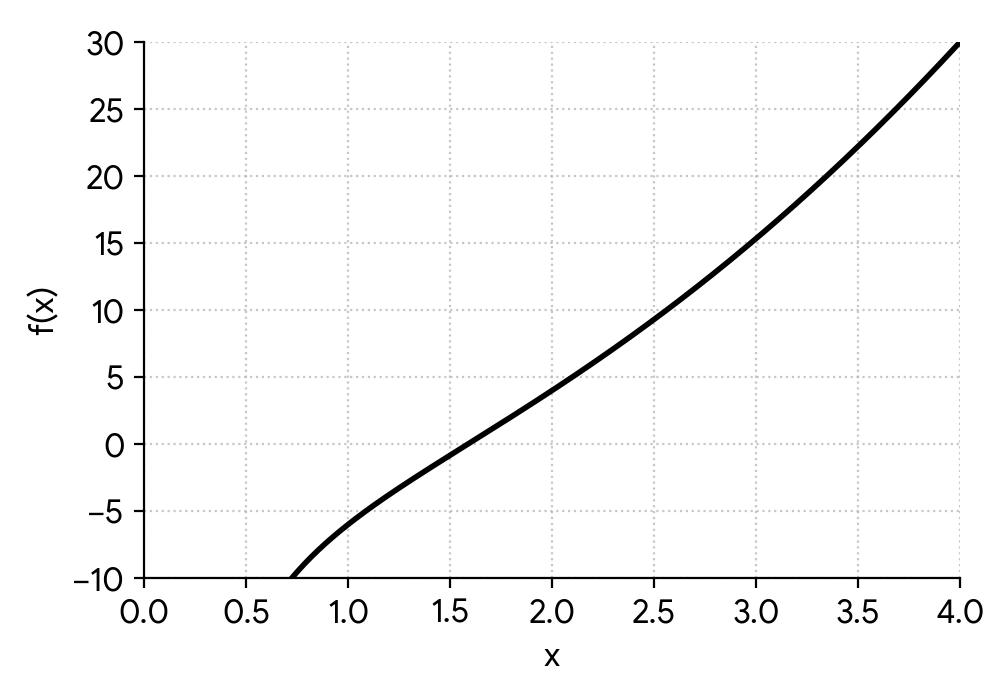
(a) (i) Sketch the graph of , for , on the same axes.
(ii) Write down the x-coordinate of the local minimum point.
(b) The company wants to find the control parameter values for which the efficiency is 10 units per hour. Use your graphic display calculator to find the solutions to the equation .
(c) Write down the equation of the vertical asymptote for the graph of .
Analyze the behavior of the function as approaches 0 from the left, as approaches -4, and find any local extrema in the domain . Remember to consider the first derivative.
Use your graphic display calculator to find the exact coordinates of the local minimum, or recall your derivative calculation from analyzing the sketch.
Graph and on your GDC and find their intersection points. Ensure you consider all possible intersections across the domain of .
Consider the behavior of the function as approaches values where the denominator becomes zero.
Question 6
HardPaper 1 · calculator9 marksThe number of visitors (in hundreds) to a new eco-tourism resort months after its opening is modelled by the function .
Sketch the graph of against for the first months, clearly indicating any intercepts and local extrema within this domain.
Find the maximum number of visitors (to the nearest whole number) during the first months.
Find the time(s) when the number of visitors is above . Give your answer in months, correct to two decimal places.
To sketch the graph, identify the -intercept by evaluating . Find any local maximum or minimum points by calculating the derivative and setting it to zero. Evaluate at the endpoints of the domain ( and ) and at any critical points. Remember to label your axes.
The maximum number of visitors corresponds to the local maximum of the function within the given time frame. You can find this by setting the first derivative to zero and solving for , or by using the GDC's maximum-finding feature. Remember that is in hundreds of visitors.
First, convert visitors into hundreds to match the units of . Then, set up an inequality or an equation and solve for . You will likely need a GDC to find the roots of the resulting cubic equation. Remember to consider the domain and interpret the inequality correctly.
Question 7
MediumPaper 1 · calculator5 marksA slope field for the differential equation is shown.
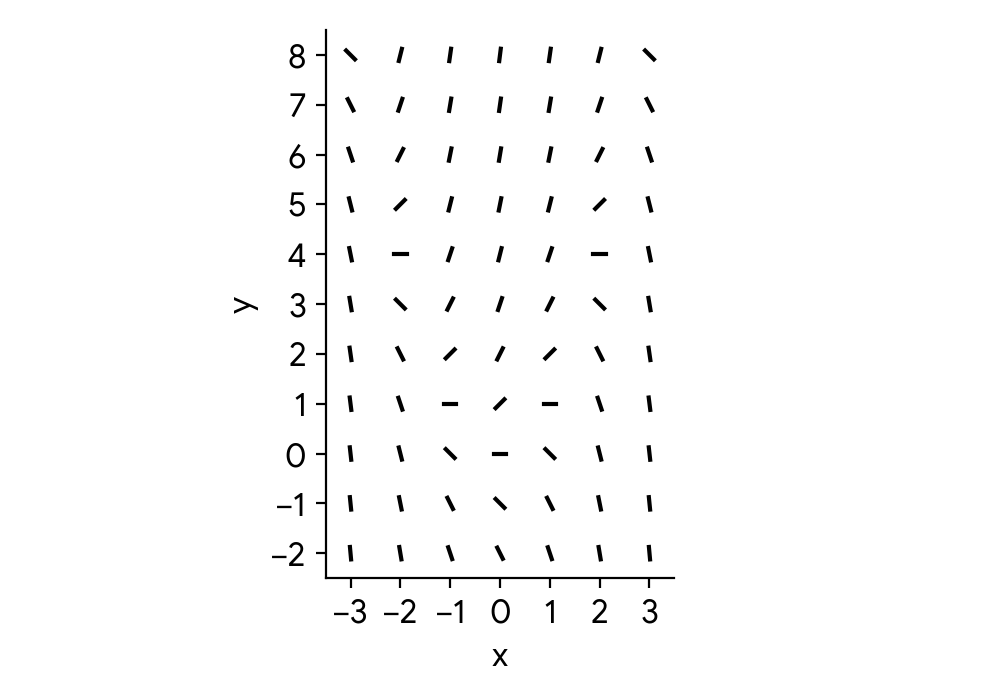
Some of the solutions to the differential equation have a local maximum point and a local minimum point.
Write down the equation of the curve on which all these maximum and minimum points lie.
Sketch this curve on the slope field.
The solution to the differential equation that passes through the point (0, 1) has both a local maximum point and a local minimum point.
On the slope field, sketch the solution to the differential equation that passes through (0, 1).
Recall that local maximum or minimum points occur where the derivative is equal to zero. Set the given differential equation to zero and solve for y in terms of x.
Plot a few points for the curve , such as (0,0), (1,1), (-1,1), (2,4), (-2,4), and then draw a smooth parabola through them on the provided slope field.
Start at the point (0, 1) and follow the direction of the slope lines. Remember that local maximum and minimum points must lie on the curve that you sketched in part (a.ii).
Question 8
HardPaper 2 · calculator13 marksA company is designing an open-top storage container with a square base. The side length of the base is cm and the height is cm. The container needs to have a volume of cm.
Explain why .
Rearrange the equation in part (a) to make the subject.
Write down an expression for the surface area, , of the open-top container.
Show that this can be written as
Plot the graph of for .
Find the minimum surface area and the value of when this occurs.
Recall the formula for the volume of a rectangular prism (or cuboid). The base is a square.
Isolate the variable on one side of the equation.
The container has a square base and four rectangular sides. Remember it is open-top.
Substitute the expression for from part (b) into the surface area formula from part (c).
Use your GDC to plot the function. Ensure you choose an appropriate window to see the minimum point.
You can use the GDC's 'minimum' function or calculus by finding the derivative and setting it to zero.
Question 9
MediumPaper 1 · calculator7 marksA metal rod is being heated in an industrial furnace. The temperature, (in ), of the rod minutes after it is placed in the furnace is modelled by the function , where is the time in minutes.
(a) Find the initial temperature of the metal rod when it is placed in the furnace.
The metal rod reaches a temperature of after minute.
(b) Find the value of .
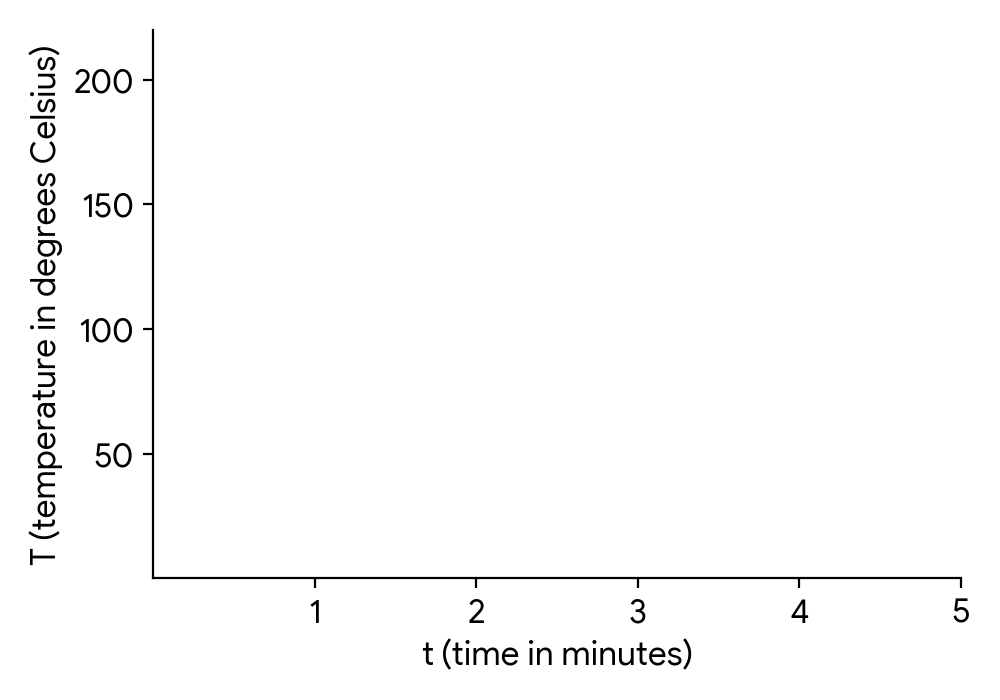
Draw the graph of on the following set of axes.
State a mathematical reason why the model predicts the temperature of the metal rod will never reach .
The initial temperature corresponds to the time . Substitute this value into the given function.
You are given a specific temperature at a specific time. Substitute these values into the function and solve for .
Use the values you found for parts (a) and (b) to plot key points. Remember to consider the behavior of the function as increases.
Consider the behavior of the exponential term as becomes very large.
Question 10
HardPaper 1 · calculator11 marks(a) A designer is creating a prototype for a decorative vase. The cross-section of the vase can be modelled by the function , for .
Sketch the graph of on the following pair of axes.
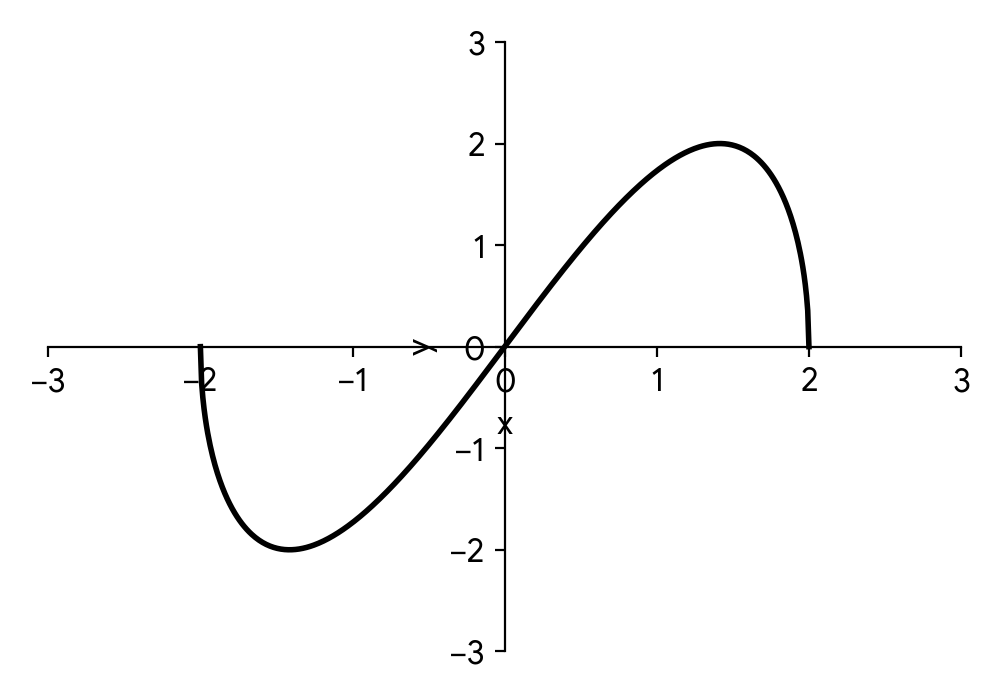
(b) The region enclosed by the graph of and the x-axis is rotated about the x-axis to form the body of the vase.
(i) Write down an integral that represents the volume of this vase.
(ii) Calculate the value of this integral.
(c) The designer decides to create a new, larger version of the vase, , by applying the following transformations to the original cross-section :
- A horizontal stretch by a scale factor of 3, parallel to the x-axis.
- A vertical stretch by a scale factor of 0.75, parallel to the y-axis.
Find the volume of this new vase.
To sketch the graph, identify key features such as x-intercepts, y-intercepts, and local maximum/minimum points. The domain is given as . Consider the symmetry of the function.
The formula for the volume of revolution about the x-axis is . Remember to use the given function and its domain as the limits of integration.
First, simplify the integrand . Then, integrate the resulting polynomial term by term. Remember to evaluate the definite integral using the limits and multiply by .
Consider how transformations affect the integral for the volume of revolution. If , how does the new integral relate to the original integral? Alternatively, express explicitly and then set up and evaluate the new integral.
Question 11
MediumPaper 1 · calculator8 marksThe graph of the function is shown in the following diagram, representing the concentration of a certain chemical in a solution over time (in minutes).
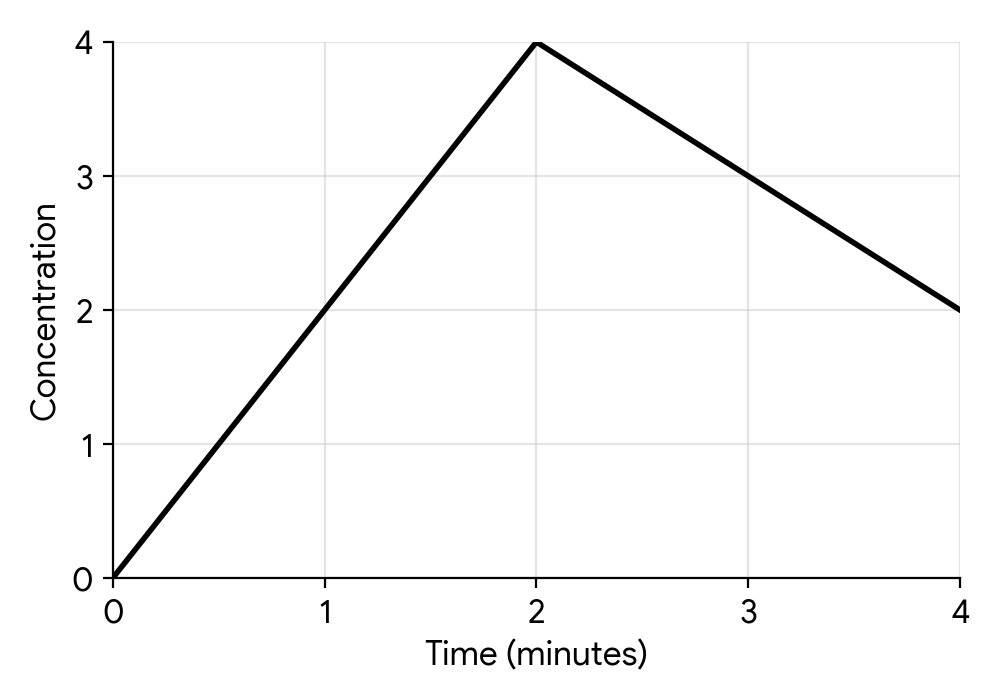
(a) Write down the concentration of the chemical at time minute.
(b) On the same axes, sketch the graph of , representing the time required to reach a certain concentration.
A different chemical's concentration, , is modeled by the function , where is time in minutes.
(c) Find an expression for .
(d) Find a value of where .
Locate on the horizontal axis and find the corresponding value on the vertical axis from the graph.
Remember that the graph of an inverse function is a reflection of the original function across the line . Identify key points on and reflect them.
To find the inverse function, replace with , swap and , and then solve for .
You can either sketch on the graph from part (b) and find the intersection, or use the algebraic expressions for and and solve the equation. Remember is piecewise, so will also be piecewise.
Question 12
HardPaper 1 · calculator7 marks(a) When the profit is zero, find the possible number of units produced, .
(b) Determine the positive values of profit, , for which there is only one positive value of (units produced).
To find the values of when the profit is zero, you need to solve the equation . You can factor out first.
Consider the graph of the profit function . To find where there is only one positive value of for a given , you need to analyze the local maximum and minimum points of the function. First, find the derivative and set it to zero to find the critical points.
Question 13
MediumPaper 2 · calculator13 marksA printing company has received a large order for flyers. The number of flyers remaining to be printed, , is modelled by the equation , where is the time in hours since printing began.
Calculate the time it will take to complete the entire order of flyers.
Determine a reasonable domain and range for this model in the context of the problem.
Sketch a graph of for the domain found in part (b).
Find and interpret its meaning in the context of the problem.
The order is complete when the number of flyers remaining to be printed is zero.
Consider the physical constraints of the problem. Time cannot be negative, and the number of flyers cannot be negative once the order is complete.
Identify the key points (intercepts) within the determined domain and draw a straight line connecting them.
Substitute the given value of into the function and explain what the resulting number represents.
Question 14
HardPaper 2 · calculator16 marksA chemical engineer is studying the concentration of an intermediate product, , in a reaction vessel. The change in concentration over time (in minutes) is modelled by the second order differential equation:
where . It is known that when , the initial concentration is and the rate of change of concentration is .
Show that the system of coupled first order equations:
can be written as the given second order differential equation.
Find the eigenvalues of the system of coupled first order equations given in part (a).
Hence find the exact solution of the second order differential equation, given the initial conditions and .
Sketch the graph of against for , labelling the maximum point of the graph with its coordinates.
If the concentration of the intermediate product exceeds arbitrary units, the reaction needs to be monitored closely. Use the model to calculate the total amount of time (in minutes) during which the reaction needs to be monitored closely.
The chemical engineer decides to monitor the reaction for 15% longer than the time found from the model in part (e).
Write down one reason, with reference to the context, to support this decision.
Differentiate the first equation with respect to and then substitute the expression for into the resulting equation. Remember that is defined as .
Form the coefficient matrix for the system of first-order differential equations. Then, find the eigenvalues by solving the characteristic equation, .
For distinct real eigenvalues and , the general solution for is of the form . Use the initial conditions to find the values of and .
To find the maximum point, set the first derivative to zero and solve for . Then substitute this value of back into the equation for to find the maximum concentration.
You need to find the values of for which . Since this equation is transcendental, you will likely need to use a GDC to find the intersection points. Then, calculate the difference between these two time values.
Consider potential uncertainties or risks in a real-world chemical process that might not be fully captured by a simplified mathematical model.
Question 15
MediumPaper 2 · calculator12 marksThe two graphs illustrate relationships within a specialized coffee roasting company.
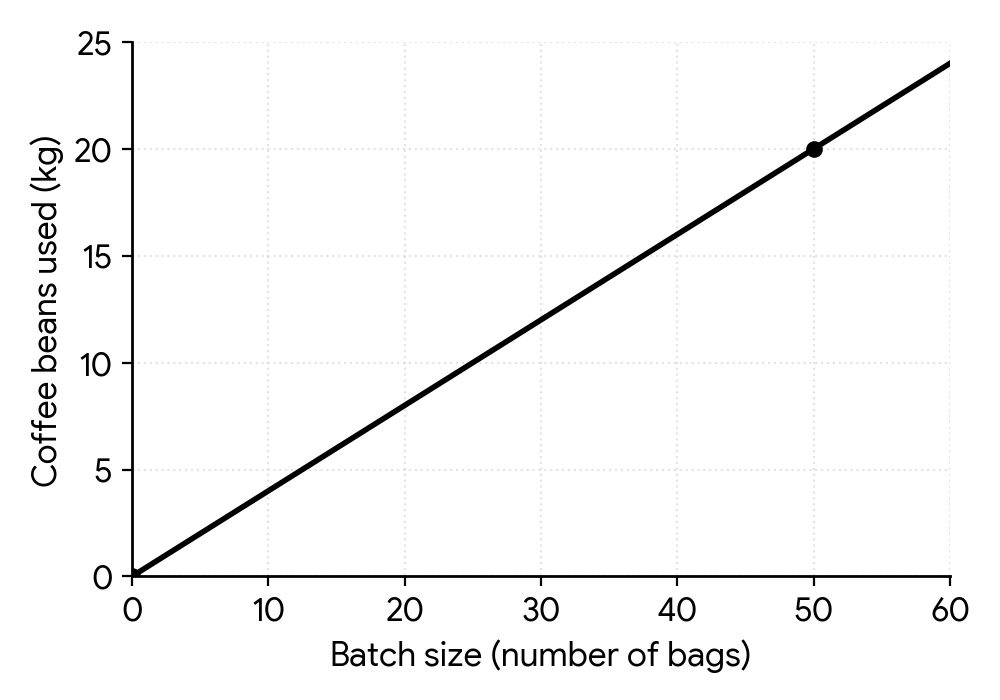
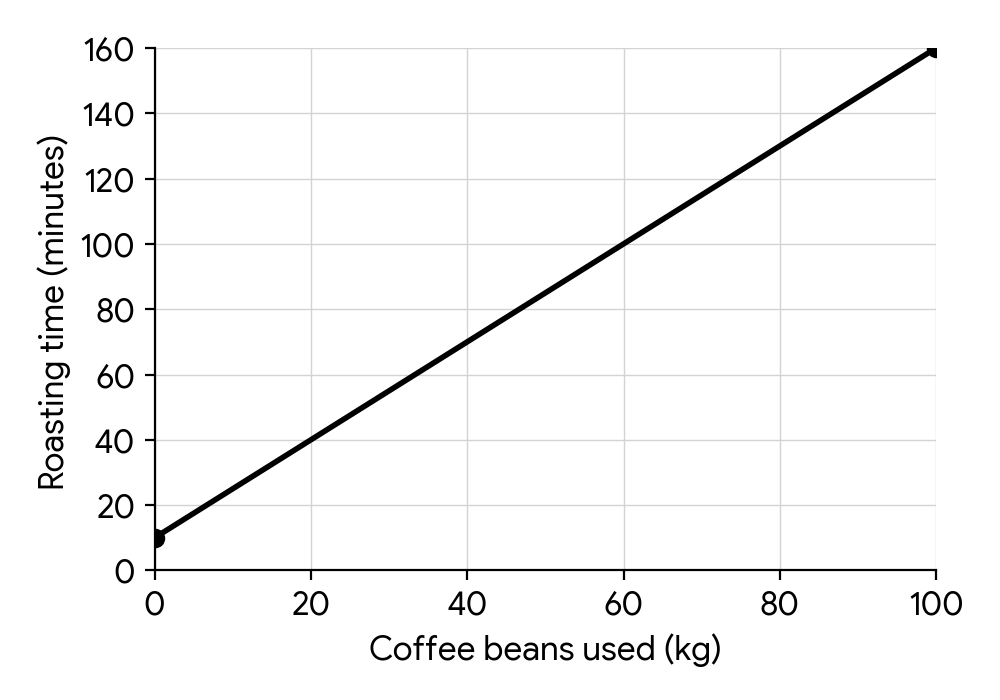
Write down which graph represents direct variation, with a reason.
(b) Find and interpret the gradient of each graph in context.
(c) Find an equation for the roasting time (in minutes) as a function of the batch size, (in number of bags), and use it to predict how long the roasting process will be for a batch of bags.
Recall the definition of direct variation and how it appears on a graph.
The gradient represents the rate of change of the y-variable with respect to the x-variable. Remember to include units in your interpretation.
You will need to combine the relationships from both graphs. First, express coffee beans used in terms of batch size, then substitute this into the equation for roasting time.
Question 16
HardPaper 2 · calculator31 marksA marine engineer is modelling the vertical displacement, meters, of a buoy from its equilibrium position at time minutes after being disturbed by a wave. The motion is described by the differential equation:
.
This equation can be rewritten as a system of coupled first-order differential equations:
.
Find the general solution for .
Initially, the buoy is at its equilibrium position () and has an initial upward velocity of m/min ().
Find an expression for in terms of .
Sketch against in the interval .
The engineer is interested in the maximum upward displacement of the buoy.
Find the time, in minutes, when this maximum displacement occurs.
Calculate the maximum upward displacement of the buoy.
An improved model for the buoy's motion, considering an external periodic force, is given by:
.
The same initial conditions as in part (b.i) apply ( and ).
Use Euler's method with a -interval of to predict the value of when .
To find the general solution of a second-order linear homogeneous differential equation, first find the characteristic equation by assuming a solution of the form . Then solve for the eigenvalues .
Use the initial conditions to set up a system of linear equations for the constants and from your general solution in part (a). Remember to differentiate your general solution first to use the initial velocity condition.
Consider the behavior of the function as increases. What is ? What is the limit as ? Is there a maximum or minimum point? Use your GDC to help you plot the function.
To find the maximum displacement, you need to find the critical points of the function . This involves setting the first derivative to zero and solving for .
Once you have the time at which the maximum displacement occurs, substitute this value of back into the original function to find the maximum displacement.
First, rewrite the second-order differential equation as a system of two first-order equations: and . Then apply Euler's method iteratively for and for 10 steps, starting from with a step size of .
Question 17
MediumPaper 1 · calculator8 marks(a) The height, metres, of a small rocket above the ground, seconds after launch, is modelled by the function . Sketch the graph of for . Clearly label any axis intercepts and the vertex.
(b) A company's daily profit, (in thousands of dollars), depends on the number of units, , it produces, according to the function . Sketch the graph of for . Clearly label any axis intercepts and the vertex.
To sketch a quadratic graph, identify its shape (opens up or down), y-intercept, x-intercepts (roots), and the coordinates of the vertex. Remember to consider the given domain for the sketch.
Similar to part (a), determine the direction the parabola opens, find the intercepts with both axes, and locate the vertex. Pay attention to the negative leading coefficient.
Question 18
MediumPaper 1 · calculator6 marksConsider the function .
Sketch the graph of for the domain .
For sketching a quadratic function, identify the vertex and the intercepts. Remember to restrict the graph to the given domain.
Question 19
MediumPaper 2 · calculator6 marksA suspension bridge arch can be modelled by a parabolic curve. The arch starts at one end of the river bank at meter and ends at the other bank at meters, where represents the horizontal distance from a central reference point. The highest point of the arch is meters above the water level.
(a) Determine the horizontal position, in meters, of the highest point of the arch.
(b) Find the equation of the parabolic curve in the form .
The highest point of a parabolic arch is its vertex. For a parabola with x-intercepts, the x-coordinate of the vertex lies exactly halfway between the intercepts.
You have the x-intercepts and the vertex's x-coordinate from part (a). The y-coordinate of the vertex is given as the highest point. Use either the vertex form or the intercept form to find the equation. Then expand it to the standard form.
Question 20
MediumPaper 1 · calculator7 marksA sculptor is designing a curved art installation whose height above the ground, in meters, can be modelled by the function , where is the horizontal distance in meters from a reference point. The installation is planned for a section from to meters.
(a) Draw the graph of the function , for , clearly indicating any local maximum or minimum points and the endpoints of the curve. Hence, determine the range of the function for this domain.
To determine the range of the function over a closed interval, you need to evaluate the function at its critical points within the interval and at the endpoints of the interval. The range will be from the absolute minimum to the absolute maximum of these values. Remember to show these points clearly on your graph.
No question on this page matches those filters. Try another difficulty or paper.
30 more Sketching graphs questions in the app
Every answer is marked mark by mark, IB-style, and the AI tutor helps when you are stuck.
Where marks are lost
- Using your own wrong value after failing a "show that." All follow through is withdrawn for the rest of that question.
- Leaving an answer in calculator notation. Never accepted in a final answer, and AI's constant calculator use makes this the easiest slip in the whole subject.
