Chi GOF, Independence, T-test (Null / Alternative hypothesis, S.L. / p-values): notes and practice questions
- Hypothesis Test: Uses sample data to test a statement about a population.
- Null Hypothesis (): Assumes no difference, no change, no association, or data follows a specific distribution.
- Alternative Hypothesis (): Opposes , claims a difference, association, or data does not follow a distribution.
- Significance Level (): Probability threshold for rejecting .
- p-value: Probability of obtaining observed (or more extreme) results assuming is true.
- Test Statistic: Calculated numerical value from sample data (e.g., , , ).
- Critical Value: Threshold for the test statistic, defining the critical region.
- Degrees of Freedom (): Parameter for and -tests.
- Type II Error (HL only): Failing to reject the null hypothesis when it is actually false.
- Decision Rule (p-value):
- If : Reject .
- If : Accept .
- Decision Rule (Test Statistic, HL only):
- If Test Statistic > Critical Value: Reject .
- If Test Statistic < Critical Value: Accept .
- Chi-Squared Test for Independence: Tests if two categorical variables are independent.
- : Variable X is independent of Variable Y.
- : Variable X is not independent of Variable Y.
- Degrees of Freedom:
- Compares observed frequencies to expected frequencies (if independent).
- Chi-Squared Goodness of Fit (GOF) Test: Tests if data fits a specific theoretical distribution.
- : The data can be modelled by the specified distribution.
- : The data cannot be modelled by the specified distribution.
- Uniform Distribution: Expected frequency is the same for all categories.
- Binomial/Normal: Calculate probabilities for intervals, then multiply by total sample size for expected frequencies.
- T-Tests and Z-Tests for the Mean: Investigate claims about the population mean ().
- One-Sample Z-Test: Used when population variance () is known.
- One-Sample T-Test: Used when population variance is unknown; calculate unbiased sample variance:
- Two-Sample T-Test: Compares means of two different, independent normally distributed populations ().
- :
- : (or ).
- Paired T-Test: Compares two sets of data from the same sample by testing the mean difference ().
- :
- : (or ).
- GDC Tips:
- Independence Tests: Enter observed frequencies into a matrix.
- GOF Tests: Enter observed frequencies into one list, calculated expected frequencies into a second list.
- T-Tests: Enter raw data into a list, or summary statistics directly.
- SL vs. HL Distinctions:
- SL: Basic (independence, GOF), t-test.
- HL: Type I/II errors, hypothesis testing for correlation, Poisson distributions, critical regions.
- Exam Tips:
- Conclusion Wording: State "There is insufficient evidence to reject the null hypothesis," not "proving it true." Conclude in context.
- Paired vs. Two-Sample: Use paired t-test if data points correspond to the same individuals under two conditions.
- IA Warning: outcome may be inaccurate if any expected values are less than 5, or if there is only 1 degree of freedom.
- One-Tailed vs. Two-Tailed: suggesting a specific direction () is one-tailed; stating a difference () is two-tailed.
How it is examined
The longest question in the SL statistics section, usually five to eight marks across several parts: state the hypotheses, give the degrees of freedom, produce the -value, compare it to the significance level, then state the conclusion in context. The conclusion mark is only earned by referring back to the situation, not by writing "reject ". Every constraint above is an easy one to break when writing a question: four rows maximum, expected frequencies above 5, upper tail only, significance level from {1%, 5%, 10%}, unpaired samples, pooled two-sample -test.
The statistic, .
- The formulation of null and alternative hypotheses, and .
- Significance levels.
- -values.
- Expected and observed frequencies.
Enrichment only, so not examinable: Yates' continuity correction.
Linking questions
- Other contexts: in psychology, the Mann-Whitney U test is common. When and why is it thought to be a more reliable test there?
- Links to other subjects: fieldwork (biology, psychology, environmental systems and societies, sports exercise and health science, geography).
- TOK: why have some research journals banned -values from their articles because they deem them too misleading? In practical terms, is saying that a result is significant the same as saying it is true? How is the term "significant" used differently in different areas of knowledge?
- Use of technology: use of simulations to generate data.
Practice questions
52 questions · 43 medium · 9 hardQuestion 1
MediumPaper 1 · calculator5 marksA lighting company technician is testing two new brands of energy-efficient light bulbs, Brand X and Brand Y. He claims that Brand X light bulbs have a shorter mean lifespan than Brand Y light bulbs.
He records the lifespans, in hours, from a random selection of light bulbs from each brand. The data is shown in the table.
| Lifespan of Brand X (hours) | 1250 | 1280 | 1230 | 1260 | 1240 | 1270 |
|---|---|---|---|---|---|---|
| Lifespan of Brand Y (hours) | 1265 | 1275 | 1255 | 1270 | 1260 | 1280 |
In order to test his claim, the technician performs a t-test at a 10% level of significance. It is assumed that the lifespans of light bulbs are normally distributed and the samples have equal variances.
State, in words, the null hypothesis ().
Calculate the p-value for this test.
State whether the result of the test supports the technician's claim. Justify your reasoning.
The null hypothesis always represents a statement of no effect or no difference. It typically includes an equality sign.
Use your GDC's two-sample t-test function. Remember to specify the correct alternative hypothesis (less than) and assume equal variances (pooled).
Compare the calculated p-value with the given significance level. If p-value < significance level, you reject the null hypothesis.
Question 2
HardPaper 1 · calculator11 marks(a) A botanist is studying a rare species of flower. They record the number of petals () on a sample of these flowers. The data is presented in the frequency table below:
5
6
7
8
9
10
Frequency
3
8
20
15
7
2
Find an unbiased estimate of the population mean number of petals for this rare flower species.
(b) Find an unbiased estimate of the population variance of the number of petals for this rare flower species.
(c) A botanist suspects that the average number of petals for this rare species is different from the average of 7.0 petals observed in a more common, related species. She sets up a hypothesis test with the null hypothesis .
(i) State the alternative hypothesis.
(ii) Given that all assumptions for this test are satisfied, carry out an appropriate hypothesis test. State and justify your conclusion, using a 10% significance level.
To find the unbiased estimate of the population mean, calculate the sum of (petal count × frequency) and divide by the total number of flowers in the sample.
Use your GDC to calculate the sample standard deviation () or variance () directly from the frequency table. Alternatively, calculate the sum of squared differences from the mean, weighted by frequency, and adjust for the unbiased estimate.
The botanist suspects the average is 'different from', which implies a two-tailed test.
Since the population standard deviation is unknown and you have sample data, a t-test is appropriate. Remember to use the unbiased estimate of the standard deviation and consider if it's a one-tailed or two-tailed test.
Question 3
MediumPaper 1 · calculator8 marksA bakery owner, "The Daily Loaf", wants to determine if the sales of their signature "Morning Glory Muffin" are consistent throughout the work week. They believe that the number of muffins sold is the same each day.
To test this, they record the number of muffins sold each weekday during a particular week. This data is shown in the table.
Day | Monday | Tuesday | Wednesday | Thursday | Friday
Number of muffins sold | 120 | 135 | 115 | 140 | 150
A goodness of fit test at the 5% significance level is used on this data to determine whether the owner's belief is suitable.
The critical value for the test is 9.49 and the hypotheses are:
: The number of Morning Glory Muffins sold is consistent across weekdays.
: The number of Morning Glory Muffins sold is not consistent across weekdays.
Find an estimate for how many Morning Glory Muffins the owner expects to sell each day.
Write down the degrees of freedom for this test.
Calculate the statistic for this data.
Using the critical value of 9.49, state the conclusion to the test. Give a reason for your answer.
To find the expected number of sales per day, consider the total sales observed and the number of days.
The degrees of freedom for a goodness of fit test are calculated as the number of categories minus one.
Recall the formula for the chi-squared statistic: , where are the observed frequencies and are the expected frequencies.
Compare your calculated statistic with the given critical value. Remember the significance level and what it means for rejecting or not rejecting the null hypothesis.
Question 4
HardPaper 2 · calculator14 marksA manufacturer claims that the lifespan of a new batch of LED light bulbs follows a normal distribution with a mean of hours and a standard deviation of hours. To test this claim, a random sample of light bulbs was selected, and their lifespans were recorded. The observed frequencies are shown in the table below.
| Lifespan (hours) | Observed Frequency |
|---|---|
(a) Copy and complete the following table of expected frequencies, assuming the manufacturer's claim is true. Give your answers to two decimal places.
Using a distribution at the level of significance, test the hypothesis that the lifespan of the light bulbs follows a normal distribution with mean hours and standard deviation hours.
You should state the null and alternative hypotheses, clearly show your working for the statistic, and justify your conclusion.
The correct critical value may be selected from the following table, where is the value such that .
| Degrees of freedom | |
|---|---|
To find the expected frequencies, first calculate the probability for each lifespan interval using the normal distribution with the given mean and standard deviation. You will need to use the normal cumulative distribution function (CDF). Then, multiply each probability by the total number of light bulbs in the sample () to get the expected frequency.
Start by stating your null and alternative hypotheses. Then, using the observed frequencies from the question and the expected frequencies you calculated in part (a), calculate the test statistic. Remember to check if any expected frequencies are less than 5; if so, you'll need to combine categories and adjust the degrees of freedom accordingly. Finally, compare your calculated value with the critical value from the table to draw a conclusion.
Question 5
MediumPaper 1 · calculator6 marksA botanist is investigating the effectiveness of two new fertilizers, 'GrowthBoost' (G) and 'VitaCrop' (V), on the height increase of a specific plant species. They treat 10 plants with GrowthBoost and another 10 plants with VitaCrop, recording the height increase (in cm) over a month. The aim is to determine if GrowthBoost leads to a significantly greater height increase than VitaCrop.
The results obtained are summarized in the following table:
Height increase with GrowthBoost (cm) | 15.0 | 15.5 | 14.8 | 15.3 | 15.6 | 15.1 | 15.4 | 14.9 | 15.7 | 15.2
Height increase with VitaCrop (cm) | 14.9 | 15.4 | 14.7 | 15.2 | 15.1 | 14.8 | 15.0 | 14.6 | 15.3 | 14.7
A t-test is to be performed at the 5% significance level.
(a) Write down the null and alternative hypotheses.
(b) Find the p-value for this test.
(c) Write down the conclusion to the test. Give a reason for your answer.
Remember that the null hypothesis (H₀) always states that there is no difference or no effect, while the alternative hypothesis (H₁) states what you are trying to prove. Pay attention to whether it's a one-tailed or two-tailed test.
Use your GDC to perform a two-sample t-test for independent samples. Remember to check if it's a one-tailed or two-tailed test based on your alternative hypothesis.
Compare your p-value to the significance level (5% or 0.05). If p < α, you reject the null hypothesis. If p ≥ α, you do not reject the null hypothesis.
Question 6
HardPaper 1 · calculator9 marks(a) A company produces a new board game that includes a four-sided spinner. The spinner is designed to be fair, meaning each side (labelled 1, 2, 3, 4) should have an equal probability of being spun. During a quality control test, the spinner is spun times. The observed frequencies are:
| Number on spinner | ||||
|---|---|---|---|---|
| Frequency |
Find the expected frequencies for each number if the spinner is fair.
(b) Write down the number of degrees of freedom for this test.
(c) The critical value for a goodness of fit test at the significance level with the appropriate degrees of freedom is .
Determine the results of a goodness of fit test to find out whether the observed data fits a uniform distribution. Remember to write down the null and alternative hypotheses.
For a fair spinner, each outcome should have an equal probability. The expected frequency is the total number of trials multiplied by this probability.
The degrees of freedom for a goodness of fit test is calculated as the number of categories minus one.
First, state the null and alternative hypotheses. Then, calculate the chi-squared test statistic using the formula . Finally, compare this value to the given critical value and draw a conclusion in context.
Question 7
MediumPaper 1 · calculator7 marksA confectionary company claims that its bags of "Rainbow Bites" candies contain an equal proportion of six different colors: Red, Orange, Yellow, Green, Blue, and Purple. A consumer group suspects this claim is false. They open a large bag containing 120 candies and count the number of each color. The observed frequencies are shown in the table below:
| Color | Red | Orange | Yellow | Green | Blue | Purple |
|---|---|---|---|---|---|---|
| Frequency | 18 | 23 | 15 | 25 | 17 | 22 |
The consumer group carries out a goodness of fit test at a 5% significance level.
(a) Write down the null and alternative hypotheses.
(b) Write down the degrees of freedom.
(c) Write down the expected frequency of any color.
(d) Find the p-value for the test.
(e) State the conclusion of the test. Give a reason for your answer.
Recall the definitions of null and alternative hypotheses for a goodness of fit test. The null hypothesis usually states that there is no difference or that the distribution matches the expected one.
The degrees of freedom for a goodness of fit test are calculated as (number of categories - 1).
If the null hypothesis is true and there are an equal proportion of colors, how would you distribute the total number of candies among the six colors?
Use your GDC's goodness of fit test function. You will need to input the observed and expected frequencies, and the degrees of freedom.
Compare your p-value from part (d) to the significance level given in the question (5%). Remember what it means to reject or not reject the null hypothesis.
Question 8
HardPaper 2 · calculator16 marksA factory produces electronic components. A quality control inspector randomly selects a batch of components and checks for defects. This process is repeated for batches. The number of defective components in each batch is recorded as shown in the table below.
| Number of defects () | ||||
|---|---|---|---|---|
| Frequency |
The manager claims that the number of defective components in a batch of follows a binomial distribution .
Show that the expected frequency for a batch having defective components is .
Find the table of expected frequencies for the number of defective components in batches, assuming the binomial distribution .
State the null and alternative hypotheses for a goodness-of-fit test. Justify any necessary adjustments to the categories for the test and state the degrees of freedom.
Calculate the Chi-squared test statistic for this data, using the adjusted categories and assuming a significance level. The critical value for this test is .
State the conclusion for the test, justifying your answer.
To find the expected frequency, first calculate the probability of getting 0 defective components using the binomial probability formula . Then multiply this probability by the total number of batches.
Calculate the binomial probability for and defects, then multiply each probability by the total number of batches () to get the expected frequencies.
Remember the conditions for a Chi-squared goodness-of-fit test, particularly regarding expected frequencies. The degrees of freedom for a goodness-of-fit test are , where is the number of categories and is the number of parameters estimated from the data.
Use the formula with the combined observed and expected frequencies. Remember to use the combined categories: .
Compare your calculated Chi-squared test statistic with the given critical value. If the test statistic is less than the critical value, you do not reject the null hypothesis.
Question 9
MediumPaper 1 · calculator6 marksA team of agricultural scientists is investigating the effectiveness of two new fertilizers, BioGrow and NutriBloom, on the growth of a specific plant species. They applied each fertilizer to a separate group of 10 plants and measured the height, in cm, of each plant after a month. The aim is to determine if BioGrow leads to significantly taller plants compared to NutriBloom.
The results obtained are summarized in the following table:
| Fertilizer | Sample Size (n) | Sample Mean Height (cm) | Sample Standard Deviation (cm) |
|---|---|---|---|
| BioGrow | 10 | 46.9 | 5.56 |
| NutriBloom | 10 | 43.1 | 4.82 |
A t-test is to be performed at the 5% significance level, assuming equal population variances.
(a) Write down the null and alternative hypotheses.
(b) Find the p-value for this test.
(c) Write down the conclusion to the test. Give a reason for your answer.
Remember to define your population parameters and consider the direction of the alternative hypothesis based on the research question.
Use your GDC's two-sample t-test function with the provided summary statistics. Ensure you select the correct alternative hypothesis for a one-tailed test.
Compare your p-value to the given significance level (5% or 0.05).
Question 10
HardPaper 2 · calculator21 marksThe lifespans, , of 250 LED light bulbs are recorded in the following table.
| Lifespan (hours) | Frequency |
|---|---|
| 20 | |
| 60 | |
| 90 | |
| 55 | |
| 25 |
This table is used to create a cumulative frequency graph.
Write down the mid-interval value of the class .
Calculate an estimate of the mean lifespan of the 250 light bulbs.
Use the cumulative frequency curve (which would be provided in an exam) to estimate the interquartile range. Assume the lower quartile () is hours and the upper quartile () is hours.
A light bulb from the data set had a lifespan of hours.
Use your answer to part (b) to estimate whether this light bulb's lifespan is an outlier for this data. Justify your answer.
It is believed that the lifespans of these LED light bulbs follow a normal distribution with mean hours and standard deviation hours.
It is decided to perform a goodness of fit test on the data to determine whether this sample of 250 light bulbs could have plausibly been drawn from an underlying distribution .
Write down the null and the alternative hypotheses for the test.
As part of the test, the following table is created.
| Lifespan of light bulb (hours) | Observed frequency | Expected frequency |
|---|---|---|
| 20 | 14.0 | |
| 60 | 60.1 | |
| 90 | a | |
| 55 | 60.1 | |
| 25 | b |
Find the value of and the value of . Give your answers to one decimal place.
Hence, perform the test to a 5% significance level, clearly stating the conclusion in context.
The mid-interval value is the average of the lower and upper bounds of the class interval.
To estimate the mean from grouped data, multiply each mid-interval value by its corresponding frequency, sum these products, and then divide by the total frequency.
The interquartile range (IQR) is the difference between the upper quartile () and the lower quartile ().
An outlier is typically defined as a value that is more than below or above . Calculate the upper bound for outliers.
The null hypothesis () usually states that there is no difference or that the data fits the proposed model. The alternative hypothesis () states that there is a difference or the data does not fit the model.
For a normal distribution , the probability can be found using the cumulative distribution function (CDF), . Then, multiply this probability by the total number of observations to get the expected frequency.
Calculate the Chi-squared test statistic using the formula . Then find the p-value using the degrees of freedom (). Compare the p-value to the significance level to draw a conclusion.
Question 11
MediumPaper 1 · calculator8 marksA new trendy cafe is trying to understand customer behaviour regarding their signature 'Aurora Brew' drink. They hypothesize that the number of 'Aurora Brew' orders is evenly distributed throughout the day's main periods.
To test this model, they record the number of 'Aurora Brew' orders during four distinct time slots over a typical day. This data is shown in the table below.
| Time Slot | Number of Orders |
|---|---|
| Morning (8 AM - 11 AM) | 45 |
| Lunch (11 AM - 2 PM) | 62 |
| Afternoon (2 PM - 5 PM) | 38 |
| Evening (5 PM - 8 PM) | 55 |
(a) Find an estimate for how many 'Aurora Brew' orders the cafe expects to receive during each time slot, according to their model.
(b) A goodness of fit test at the 5% significance level is used on this data to determine whether the cafe's model is suitable. The critical value for the test is 7.815.
(i) State the null and alternative hypotheses for this test.
(ii) Write down the degrees of freedom for this test.
(iii) Calculate the test statistic and write down the conclusion to the test. Give a reason for your answer.
The model assumes an even distribution. How would you calculate the expected value if the total number of orders is distributed equally among all categories?
Remember that the null hypothesis () represents the status quo or the model being tested (in this case, an even distribution). The alternative hypothesis () suggests that the model is not suitable.
The degrees of freedom for a Chi-squared goodness of fit test are calculated as the number of categories minus one.
Use the formula , where are the observed frequencies and are the expected frequencies. Compare your calculated value with the given critical value to draw a conclusion.
Question 12
HardPaper 2 · calculator25 marksThe lifespan of a new type of LED bulb, in hours, can be modelled by a normal distribution with a mean of hours and a standard deviation of hours.
A randomly selected LED bulb is chosen.
(a) Calculate the probability that its lifespan is
(i) less than hours.
(ii) between hours and hours.
(b) of LED bulbs have a lifespan of more than hours.
Calculate the value of .
A manufacturer wants to determine if a sample of LED bulbs from a new production batch could have been chosen from a normally distributed population with a mean of hours and a standard deviation of hours.
They perform a goodness of fit test at the significance level. They begin by creating the following frequency table:
| Lifespan, (hours) | Observed frequency | Expected frequency |
|---|---|---|
| a | ||
| b | ||
(c) Calculate, correct to four significant figures, the value of
(i) a.
(ii) b.
The hypotheses for the manufacturer's test are:
: The lifespans of the LED bulbs are drawn from a normally distributed population with mean hours and standard deviation hours.
: The lifespans of the LED bulbs are not drawn from a normally distributed population with mean hours and standard deviation hours.
(d) Write down the degrees of freedom for this test.
The critical value for this test is .
(e) Perform the goodness of fit test and state your conclusion, justifying your reasoning.
A competitor claims that their new 'Brand A' LED bulbs last longer on average than the manufacturer's 'Brand B' LED bulbs.
Random samples of Brand A bulbs and Brand B bulbs are chosen, and their lifespans (in hours) are measured:
Lifespans of Brand A bulbs (hours):
Lifespans of Brand B bulbs (hours):
The competitor performs a t-test at the significance level. It is assumed that the populations are normally distributed and have equal variances.
(f) Write down the null and alternative hypotheses for this test.
(g) Perform the t-test and state the conclusion, justifying your reasoning.
For a normal distribution, use the normal cumulative distribution function (normal CDF) on your GDC. Remember to input the lower bound, upper bound, mean, and standard deviation.
For the probability between two values, use the normal CDF with the given lower and upper bounds.
If of bulbs last more than hours, then of bulbs last less than or equal to hours. Use the inverse normal function on your GDC.
To find the expected frequency for a category, calculate the probability of a bulb's lifespan falling into that category using the normal distribution, then multiply by the total sample size (). For 'a', calculate .
For 'b', calculate . Alternatively, if you have calculated 'a' and the other expected frequencies, you can subtract them from the total sample size ().
The degrees of freedom for a goodness of fit test are calculated as (number of categories - 1 - number of parameters estimated from the sample). In this case, the mean and standard deviation are given, not estimated.
Use your GDC to perform the GOF test. Compare the p-value to the significance level or the statistic to the critical value.
The null hypothesis () always states that there is no difference or no effect. The alternative hypothesis () reflects the claim being tested, which is that Brand A bulbs last longer on average.
Use your GDC's two-sample t-test function. Ensure you select 'pooled' for equal variances and the correct alternative hypothesis (one-tailed). Compare the p-value to the significance level.
Question 13
MediumPaper 1 · calculator6 marksA team of agricultural scientists is investigating the effectiveness of two new organic fertilizers, 'TerraGrow' and 'VitaBloom', on the growth of a specific type of leafy green vegetable. They hypothesize that one fertilizer might lead to significantly taller plants.
They conducted an experiment where 14 identical plant seedlings were randomly divided into two independent groups. One group was treated with TerraGrow, and the other with VitaBloom. After four weeks, the height of each plant, in cm, was measured.
The data collected is shown in the following table:
| TerraGrow (cm) | VitaBloom (cm) |
|---|---|
| 12.5 | 11.8 |
| 14.1 | 12.0 |
| 13.0 | 13.5 |
| 15.2 | 12.2 |
| 13.8 | 11.5 |
| 14.5 | 13.0 |
| 12.9 | 12.8 |
At the 5% level of significance, a t-test was used to compare the mean plant heights produced by the two fertilizers. Each data set is assumed to be normally distributed, and the population variances are assumed to be the same.
Let be the population mean height for plants treated with TerraGrow and be the population mean height for plants treated with VitaBloom. The null hypothesis for this test is .
State the alternative hypothesis.
Calculate the p-value for this test.
State the conclusion of the test. Justify your answer.
State what your conclusion means in context.
Recall the definition of the alternative hypothesis in a two-tailed t-test when the null hypothesis states that the difference between two population means is zero.
Use your GDC's two-sample t-test function. Ensure you select 'pooled' or 'equal variances' if available, as stated in the question.
Compare the calculated p-value to the given significance level (5%). What does this comparison imply about rejecting or failing to reject the null hypothesis?
If you rejected the null hypothesis, what does that mean for the effectiveness of the two fertilizers on plant height? Make sure to refer to the population means.
Question 14
HardPaper 2 · calculator21 marksA company manufactures specialized medical devices. Each device consists of a main circuit board and a protective casing. The weight of the circuit board, , is normally distributed with a mean of g and a standard deviation of g. The weight of the protective casing, , is normally distributed with a mean of g and a standard deviation of g. The weights of the circuit board and the casing are independent.
Find the probability that a randomly chosen complete device has a total weight of less than g.
A batch of such devices is to be packed into a container. The container has a maximum weight capacity of g. The weight of each device is independent.
Find the probability that the total weight of the devices is greater than the capacity of the container.
The company sources a critical microchip component from two different suppliers, Supplier X and Supplier Y. An engineer claims that microchips from Supplier Y have a lower response time than those from Supplier X. To test this claim, a random sample is taken from each supplier.
The eight microchips in the sample from Supplier X have response times, in milliseconds (ms), of:
.
Find the
(i) mean response time for the sample from Supplier X.
Find the
(ii) unbiased estimate of the population variance for the sample from Supplier X.
The seven microchips in the sample from Supplier Y have a mean response time of ms and an unbiased estimate of the population standard deviation () of ms.
Perform a suitable test, at the significance level, to test the engineer's claim that microchips from Supplier Y have a lower response time than those from Supplier X. You may assume the response times of microchips from each supplier are normally distributed with equal population variance.
The total weight of the device is the sum of the circuit board weight and the casing weight. When combining independent normal random variables, their means add, and their variances add. Remember that the standard deviation is the square root of the variance. Once you have the mean and standard deviation of the total weight, you can use the normal distribution to find the required probability.
Let be the total weight of the devices. Since each device's weight is normally distributed and independent, the sum of such weights will also be normally distributed. The mean of the sum will be times the mean of a single device, and the variance of the sum will be times the variance of a single device. Use the mean and variance calculated in part (a).
To find the mean of a sample, sum all the values in the sample and divide by the number of values in the sample.
The unbiased estimate of the population variance, , is calculated using the formula , where is the sample size and is the sample mean. Be careful to use in the denominator.
This is a hypothesis test comparing the means of two independent samples. Since the population standard deviations are unknown but assumed equal, and the samples are from normally distributed populations, a two-sample t-test (pooled variance) is appropriate. Remember to state the null and alternative hypotheses, calculate the test statistic and p-value, and draw a conclusion in context based on the significance level.
Question 15
MediumPaper 1 · calculator6 marksDr. Anya Sharma is investigating the effectiveness of a new 'active recall' study technique compared to a 'traditional review' method for improving student performance on a challenging physics exam. She believes that students using the active recall technique will achieve higher mean scores.
Dr. Sharma conducts an experiment with two random samples of students. The results are summarized below:
- Active Recall Group (Group A): Sample size , mean score , sample standard deviation .
- Traditional Review Group (Group T): Sample size , mean score , sample standard deviation .
Dr. Sharma performs a one-tailed t-test at a 5% level of significance. It is assumed that the exam scores are normally distributed and the samples have equal variances.
State the null and alternative hypotheses for this test.
Calculate the p-value for this test.
State the conclusion of the test in the context of the question. Justify your answer.
Remember that the null hypothesis typically represents no effect or no difference, while the alternative hypothesis reflects the researcher's claim or what they are trying to prove. Pay attention to the direction of the inequality for a one-tailed test.
You will need to calculate the pooled standard deviation and the t-statistic first. Then, use the degrees of freedom to find the p-value for a one-tailed test. A GDC is highly recommended for these calculations.
Compare the p-value you calculated in part (b) with the significance level given in the question (5%). Based on this comparison, decide whether to reject or fail to reject the null hypothesis, and then interpret this decision in terms of Dr. Sharma's investigation.
Question 16
HardPaper 2 · calculator21 marks(a) The scores, , of 200 students on a mathematics test are recorded in the following table.
| Score () | Frequency |
|---|---|
| 15 | |
| 35 | |
| 60 | |
| 50 | |
| 30 | |
| 10 |
(i) Write down the mid-interval value of .
(ii) Calculate an estimate of the mean score of the 200 students.
(b) The data from this table is used to create a cumulative frequency graph. From this graph, the first quartile () is estimated to be and the third quartile () is estimated to be .
Use these values to estimate the interquartile range (IQR).
(c) A student, Elara, scored on the test.
Use your answer to part (b) to estimate whether Elara's score is an outlier for this data. Justify your answer.
(d) It is believed that the scores of students on this mathematics test follow a normal distribution with mean and standard deviation .
It is decided to perform a goodness of fit test on the data to determine whether this sample of 200 students could have plausibly been drawn from an underlying distribution .
Write down the null and the alternative hypotheses for the test.
(e) As part of the test, the following table is created, where some categories have been combined to ensure expected frequencies are not too low.
| Score () | Observed Frequency | Expected Frequency |
|---|---|---|
| 15 | 6.08 | |
| 35 | 32.08 | |
| 60 | a | |
| 50 | 63.99 | |
| 40 | b |
(i) Find the value of and the value of .
(ii) Hence, perform the test to a 5% significance level, clearly stating the conclusion in context.
The mid-interval value is the average of the lower and upper bounds of the interval.
To estimate the mean from grouped data, multiply each mid-interval value by its frequency, sum these products, and then divide by the total number of students.
The interquartile range (IQR) is the difference between the third quartile () and the first quartile ().
An outlier is typically defined as a value that is more than below or above . Calculate the upper and lower bounds for outliers.
The null hypothesis () states that there is no significant difference, while the alternative hypothesis () states that there is a significant difference. Make sure to reference the specific distribution parameters.
(i) Use the normal distribution to calculate the probabilities for the given intervals and multiply by the total number of students (200) to find the expected frequencies.
(ii) Calculate the statistic and the p-value. The degrees of freedom for a goodness-of-fit test when parameters are given is (number of categories - 1). Compare the p-value to the significance level to draw a conclusion.
Question 17
MediumPaper 1 · calculator6 marks[Maximum mark: 6]
A university is investigating the relationship between student engagement in extracurricular activities and their academic performance. A random sample of 470 students was selected, and their engagement level (Low, Medium, High) and academic performance (Below Average, Average, Above Average) were recorded. The data is summarized in the following table.
| Low Engagement | Medium Engagement | High Engagement | Total | |
|---|---|---|---|---|
| Below Average | 45 | 30 | 15 | 90 |
| Average | 60 | 90 | 70 | 220 |
| Above Average | 25 | 50 | 85 | 160 |
| Total | 130 | 170 | 170 | 470 |
An item of food is chosen at random from these 500.
(a) Find the probability that a randomly chosen student has 'Below Average' academic performance, given that they have 'Low' engagement.
A test at the 5% significance level is carried out to determine if there is a significant relationship between student engagement and academic performance.
The critical value for this test is 9.488.
The hypotheses for this test are:
: Student engagement in extracurricular activities and academic performance are independent.
: Student engagement in extracurricular activities and academic performance are not independent.
(b) Find the statistic.
(c) State, with justification, the conclusion for this test.
Recall the formula for conditional probability: P(A|B) = P(A and B) / P(B). Identify the event A and event B from the question, and use the counts from the table.
Use your GDC's chi-squared test function. Input the observed frequency table to calculate the chi-squared statistic.
Compare the calculated statistic from part (b) with the given critical value. Alternatively, compare the p-value (which your GDC also provides) with the significance level (0.05).
Question 18
HardPaper 3 · calculator27 marks(a) Mr. Lee, the owner of "Sweet Delights" bakery, recorded the number of Mooncakes sold each day for a sample of days. The results are shown in the table below.
| Number of Mooncakes sold | Frequency |
|---|---|
| 0 | 1 |
| 1 | 2 |
| 2 | 4 |
| 3 | 5 |
| 4 | 7 |
| 5 | 6 |
| 6 | 3 |
| 7 | 2 |
(a.i) Find the mean and variance for this sample data.
(a.ii) Hence, state why Mr. Lee might believe that the daily sales of Mooncakes follow a Poisson distribution.
(b) State one assumption that Mr. Lee needs to make about the sales of Mooncakes to support his belief that it follows a Poisson distribution.
(c) Mr. Lee knows from his historic sales records that the bakery sells an average of Mooncakes each day. The following table shows the expected frequency of Mooncakes sold each day during a -day period, assuming a Poisson distribution with mean .
| Number of Mooncakes sold | <1 | 1 | 2 | 3 | 4 | 5 | 6 | 7 | |
|---|---|---|---|---|---|---|---|---|---|
| Expected frequency | a | b | c |
Find the value of a, of b, and of c. Give your answers to 3 decimal places.
(d) Mr. Lee decides to carry out a goodness of fit test at the significance level to see whether the daily sales of Mooncakes follow a Poisson distribution with mean . He collects observed frequencies for days, which are given in the table below.
| Number of Mooncakes sold | <2 | 2 | 3 | 4 | 5 | 6 | |
|---|---|---|---|---|---|---|---|
| Observed frequency | 12 | 13 | 23 | 17 | 12 | 10 | 13 |
| Expected frequency |
(d.i) Write down the number of degrees of freedom for his test.
(d.ii) Perform the goodness of fit test and state, with reason, a conclusion.
(e) Mr. Lee claims that a new social media advertising campaign, costing THB per day, will increase the number of Mooncakes sold. However, his business partner, Ms. Chen, claims that the advertising will not increase the bakery's overall profit.
Ms. Chen agrees to run the campaign for the next days. During that time, Mr. Lee records that the bakery sells a total of Mooncakes, with a profit of THB on each Mooncake sold.
Mr. Lee wants to carry out an appropriate hypothesis test to determine whether the number of Mooncakes sold during the days increased when compared with the historic sales records (mean Mooncakes per day).
By finding a critical value, perform this test at a significance level.
(f) Hence state the probability of a Type I error for this test.
(g) By considering the claims of both Mr. Lee and Ms. Chen, explain whether the advertising campaign was beneficial to the bakery.
To find the mean, calculate the sum of (number of mooncakes frequency) and divide by the total frequency. For the variance, use the formula for sample variance, .
Recall the relationship between the mean and variance for a Poisson distribution.
Consider the characteristics of events that follow a Poisson distribution, such as independence or constant rate.
Use the Poisson probability mass function to find the probabilities for each category. Multiply these probabilities by the total number of days () to get the expected frequencies. For '', calculate .
The degrees of freedom for a goodness of fit test are , where is the number of categories and is the number of parameters estimated from the data. In this case, the mean is given.
First, state the null and alternative hypotheses. Then, calculate the test statistic using the formula . Use your GDC to find the p-value for the calculated test statistic and degrees of freedom. Compare the p-value to the significance level to draw a conclusion.
First, calculate the expected total number of Mooncakes sold over 40 days based on the historic mean. Define your null and alternative hypotheses. Since this is a Poisson distribution, you need to find the critical value such that , where follows a Poisson distribution with the expected total mean. Compare the observed total sales with this critical value.
The probability of a Type I error is the significance level of the test, specifically, the probability of rejecting the null hypothesis when it is actually true. This is the probability of observing a result as extreme as, or more extreme than, the critical value, assuming the null hypothesis is true.
Calculate the total cost of the advertising campaign and the additional profit generated from the increased sales. Compare these two values to determine the overall financial impact.
Question 19
MediumPaper 1 · calculator7 marksA tech company launched two new smartphone models, "Voyager" and "Explorer". They collected customer satisfaction scores (out of 100) from a large sample of users for both models. The results are summarized in the following box and whisker diagram.
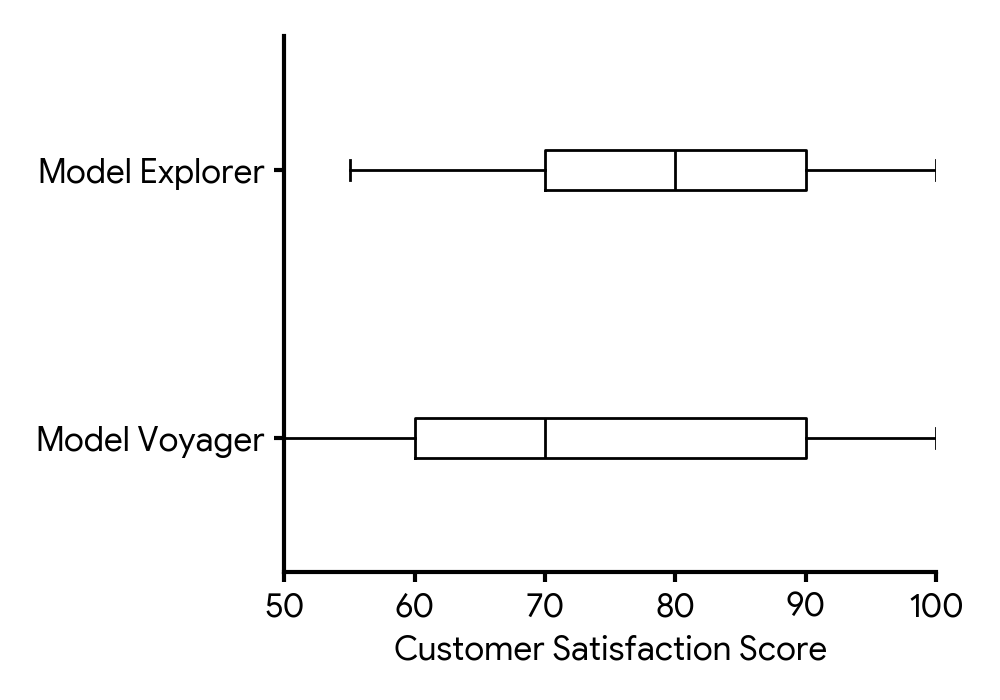
Identify which two of the following statements must be true according to the box and whisker diagram. Indicate your choices by placing tick marks in the second column of the following table.
Statement | True (✓)
---|---
The satisfaction scores for Model Voyager are normally distributed. |
A higher percentage of customers gave a score less than 70 for Model Voyager than for Model Explorer. |
A higher percentage of customers gave a score greater than 90 for Model Explorer than for Model Voyager. |
The interquartile range for Model Explorer is less than the interquartile range for Model Voyager. |
A product manager believes there is no significant difference in the average customer satisfaction scores between the two models. She plans to conduct a t-test at the 10% significance level. Write down the null and alternative hypotheses for her test.
The t-test yielded a p-value of 0.0783. Find the p-value for her test.
Write down the conclusion to the test. Give a reason for your answer.
Recall how percentages of data are distributed within the quartiles of a box and whisker diagram. For example, 25% of data lies below the first quartile (Q1), and 50% lies below the median. The interquartile range (IQR) is the difference between the third quartile (Q3) and the first quartile (Q1).
Remember that the null hypothesis (H₀) typically states no effect or no difference, while the alternative hypothesis (H₁) states what is being tested for (a difference). Use appropriate notation for population means.
The p-value is directly provided in the question stem.
Compare the p-value from part (c) with the significance level stated in part (b) to determine whether to reject the null hypothesis.
Question 20
MediumPaper 1 · calculator7 marksA candy manufacturer claims that a bag of their mixed candies contains four different colors (Red, Green, Blue, Yellow) in specific proportions: 20% Red, 30% Green, 25% Blue, and 25% Yellow. A consumer group suspects this claim is inaccurate. They randomly select a large bag and count the number of candies of each color, recording the observed frequencies in the following table:
| Color | Red | Green | Blue | Yellow | Total |
|---|---|---|---|---|---|
| Observed Frequency | 35 | 65 | 48 | 52 | 200 |
The consumer group decides to carry out a goodness of fit test at a 5% significance level to investigate the manufacturer's claim.
Write down the null and alternative hypotheses for this test.
Write down the degrees of freedom for this test.
Write down the expected frequency of Red candies.
Find the p-value for the test.
State the conclusion of the test. Give a reason for your answer.
Remember that the null hypothesis (H₀) represents the status quo or the claim being tested, while the alternative hypothesis (H₁) represents what is suspected if the claim is false.
The degrees of freedom for a goodness of fit test are calculated as the number of categories minus one.
The expected frequency for a category is the total number of observations multiplied by the claimed proportion for that category.
You will need to use your GDC or statistical software to calculate the Chi-squared test statistic and then the corresponding p-value. Ensure you use the correct observed and expected frequencies, and the degrees of freedom found in part (b).
Compare the p-value you calculated in part (d) with the given significance level (5% or 0.05). Based on this comparison, decide whether to reject or not reject the null hypothesis and state your conclusion in the context of the problem.
No question on this page matches those filters. Try another difficulty or paper.
32 more Chi GOF, Independence, T-test (Null / Alternative hypothesis, S.L. / p-values) questions in the app
Every answer is marked mark by mark, IB-style, and the AI tutor helps when you are stuck.
Where marks are lost
- Using your own wrong value after failing a "show that." All follow through is withdrawn for the rest of that question.
