Sketching graphs: notes and practice questions
- Involves understanding the key features of functions to produce accurate representations.
- Key concepts:
- Intercepts: -intercepts () and -intercepts ().
- Turning points: Found by setting .
- Asymptotes: Vertical ( where ) and horizontal/oblique ( as ).
- Behavior: End behavior and symmetry (odd/even).
- Transformation rules: Translations, reflections, stretches, and compressions.
- Examples include linear, quadratic, exponential, logarithmic, and trigonometric graphs.
How it is examined
The "draw versus sketch" distinction is a marking point, not a stylistic note. `Draw` means to scale, with a ruler for straight lines and points correctly plotted; `Sketch` means the right shape with the relevant features labelled. Unlabelled axes lose marks either way. Paper 2 usually, because the shape comes off the GDC. 3 to 5 marks.
- The graph of a function; its equation .
- Creating a sketch from information given or from a context, including transferring a graph from screen to paper.
- Using technology to graph functions including their sums and differences.
Linking questions
- Links to other subjects: sketching and interpreting graphs (sciences, geography, economics).
Practice questions
31 questions · 18 medium · 13 hardQuestion 1
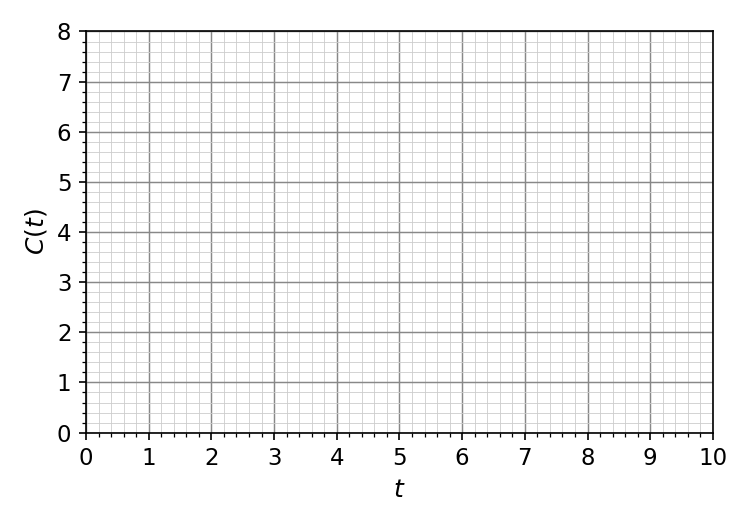
MediumPaper 2 · calculator5 marksA pharmaceutical company is testing a new drug. The concentration of the drug in a patient's bloodstream, , in mg/L, hours after administration, is modeled by the function , for .
Sketch the graph of on the grid below.
(b) Find the time, in hours, at which the concentration of the drug in the bloodstream is at its maximum.
Use your GDC to plot the function. Pay attention to the domain, the general shape of the curve, the coordinates of the local maximum, and the values at the endpoints.
The maximum concentration occurs when the rate of change of concentration with respect to time is zero. This means finding the value of for which . Use your GDC's maximum finding feature or solve .
Question 2
HardPaper 3 · calculator24 marksA biologist is modelling the growth of two different bacterial colonies. The first colony, A, grows such that its population at time is given by , where is a growth factor and . The second colony, B, grows linearly such that its population at time is .
Consider the cases where the growth factor and . On the same set of axes, sketch the following three graphs for :
Clearly label each graph with its equation and state the coordinates of any non-zero -axis intercepts.
In parts (b) and (c), consider the case where the growth factor .
Use calculus to find the minimum value of the expression , justifying that this value is a minimum.
Hence deduce that for all .
There exist values of for which the graph of and the line have different numbers of intersection points. The following table gives three intervals for the value of .
| Interval | Number of intersection points |
|---|---|
By investigating the graph of for different values of , write down the values of and .
In parts (e) and (f), consider .
For , a value of exists such that the line is a tangent to the graph of at a point P.
Find the exact coordinates of P and the exact value of .
Write down the exact set of values for such that the graphs of and have
(i) two intersection points;
(ii) no intersection points.
Ensure your sketch accurately reflects the general shape and relative positions of exponential functions with different bases and the line . Pay attention to intercepts and asymptotic behaviour.
Recall how to find local extrema using calculus by analyzing the first and second derivatives.
Consider the implications of the minimum value found in part (b) for the expression .
Visualize how the graph of changes as the value of changes, especially relative to the line . Consider the general shapes for and .
For tangency, both the function values and their derivatives must be equal at the point of contact. Let the point of tangency be .
Relate the critical value of found in part (e) to the number of intersection points. Consider the graphical behavior.
Relate the critical value of found in part (e) to the number of intersection points. Consider the graphical behavior.
Question 3
MediumPaper 2 · calculator6 marksThe amplitude of a sound wave, , is modeled by a composite function , where is time in seconds. The initial signal is given by , and the amplification stage is defined by .
(a) Find .
On the following grid, sketch the graph of for . Write down and clearly label the coordinates of any local maximum or minimum points.
Recall that . Substitute the expression for into .
Use your GDC to plot the function and find the local extrema within the given domain. Remember to label the axes and the coordinates of the points.
Question 4
HardPaper 2 · calculator20 marksA civil engineer is analyzing the structural integrity of a new bridge design. The deflection of a certain point on the bridge, , in millimeters, is modeled by the function , where represents the horizontal distance in meters from a central support. The model is valid for , , .
Find the value of and the value of .
Find an expression for .
The graph of has exactly one point of inflexion.
Find the x-coordinate of the point of inflexion.
Sketch the graph of for , showing the values of any axes intercepts, the coordinates of any local maxima and local minima (if they exist), and giving the equations of any asymptotes.
Consider a related model for stress distribution, for , .
Find the equations of all the asymptotes on the graph of .
The engineer needs to identify the regions where the bridge deflection is less than mm. Solve for .
The function is undefined when the denominator is zero. Set the denominator equal to zero and solve for x.
Use the quotient rule for differentiation: If , then .
A point of inflexion occurs where the second derivative, , is zero or undefined, and the concavity changes. You may need to use a GDC to find the root of .
Identify vertical and horizontal asymptotes, x and y-intercepts. Determine if there are any local maxima or minima by analyzing the first derivative. Plot key points and sketch the curve's behavior around asymptotes.
For vertical asymptotes, set the denominator to zero. For oblique asymptotes, perform polynomial long division to express in the form .
Rearrange the inequality to have zero on one side. Find the critical values by setting the numerator and denominator to zero. Use a sign table or graph to determine the intervals where the inequality holds.
Question 5
MediumPaper 2 · calculator5 marksConsider the function .
On the following axes, sketch the graph of for .
The function is defined by .
The graph of is obtained from the graph of (from part a) by a horizontal stretch with scale factor , followed by a vertical translation of units.
Find the value of and the value of .
To sketch the graph accurately, identify key features such as x-intercepts (roots), the y-intercept, local minimum or maximum points, and the function's values at the endpoints of the given domain. You may need to use a GDC to find the roots and the exact coordinates of the local minimum.
Consider how the input changes to for a horizontal stretch and how a constant is added or subtracted for a vertical translation. Compare the form of to .
Question 6
HardPaper 2 · calculator24 marksA team of engineers is designing a new roller coaster ride. The path of a certain section of the ride can be modelled by the function , where is the horizontal distance in metres from the starting point and is the vertical height in metres. The domain of the function is .
Find the coordinates where the path of the roller coaster crosses the horizontal ground (x-axis).
Find the coordinates where the path of the roller coaster crosses the vertical axis (y-axis).
Write down the equation of the vertical asymptote of the graph of .
The oblique asymptote of the graph of can be written as where .
Find the value of and the value of .
Sketch the graph of for , clearly indicating the points of intersection with each axis and any asymptotes.
Engineers want to analyse the inverse of the roller coaster's height function, .
Express in partial fractions.
Hence find the exact value of , expressing your answer as a single logarithm.
To find where the graph crosses the x-axis, set the numerator of the function equal to zero and solve for x. Remember to express your answer as coordinates.
To find where the graph crosses the y-axis, substitute into the function.
The vertical asymptote occurs where the denominator of a rational function is zero.
To find the oblique asymptote, perform polynomial long division of the numerator by the denominator. The quotient will be the equation of the oblique asymptote.
Plot the intercepts and draw the asymptotes first. Then sketch the two branches of the hyperbola, ensuring they approach the asymptotes and pass through the intercepts.
First, write out by taking the reciprocal of . Then, factorize the quadratic denominator and set up the partial fraction decomposition. Solve for the unknown constants.
Integrate the partial fractions found in part (e.i). Remember that . Apply the limits of integration and use logarithm properties to simplify to a single logarithm.
Question 7
MediumPaper 2 · calculator5 marksA scientist is studying the growth of a certain bacterial culture. The population, in thousands, at time hours is modeled by the function .
On the following axes, sketch the graph of for .
Another bacterial culture, observed under different conditions, has its population modeled by the function .
The graph of is obtained from the graph of by a horizontal stretch with scale factor , followed by a vertical translation of units.
Find the value of and the value of .
Use your GDC to find the key features of the function, such as the intercepts, local minimum, and the values at the endpoints of the given interval. Pay attention to the overall shape of the exponential function.
Recall how horizontal stretches and vertical translations affect the function notation. If is transformed to by a horizontal stretch with scale factor and a vertical translation of units, then . Substitute into the expression for and compare it to .
Question 8
HardPaper 2 · calculator20 marksA designer is creating a decorative glass container shaped like a dome. The outer profile of the container can be modelled by the function , where and and are measured in metres.
Sketch the curve , clearly indicating the coordinates of the endpoints.
Show that the inverse function of is given by .
State the domain and range of .
The container is formed by rotating the curve by about the y-axis. Show that the volume, , of liquid in the container when it is filled to a height of metres is given by .
Hence, determine the maximum volume of the container.
At , the container is empty. Liquid is then added to the container at a constant rate of .
Find the time it takes to fill the container to its maximum volume.
Find the rate of change of the height of the liquid when the container is filled to half its maximum volume.
Remember that the domain restricts the part of the curve you need to sketch. Identify the y-values at the given x-endpoints.
To find the inverse function, interchange and and then solve for . Remember the range of the original function.
The domain of an inverse function is the range of the original function, and vice versa.
The formula for volume of revolution about the y-axis is . Express in terms of from the original function.
The maximum height the liquid can reach is determined by the range of the original function.
Time equals total volume divided by the filling rate.
First, find the height when the volume is half the maximum. Then, use the chain rule . You'll need to differentiate the volume formula with respect to .
Question 9
MediumPaper 2 · calculator6 marksThe functions and are defined by and .
(a) Find .
On the following grid, sketch the graph of for . Write down and clearly label the coordinates of any local maximum or minimum points.
Remember that . Substitute the expression for into .
Use your GDC to find the coordinates of the local maximum and minimum points. Pay attention to the specified domain . Remember to express values in radians.
Question 10
HardPaper 2 · calculator19 marksA pharmaceutical company is testing a new drug. The concentration of the drug, , in the bloodstream of a patient, in micrograms per millilitre (), hours after administration, is modelled by the function , for .
Sketch the graph of for , clearly indicating the coordinates of the initial concentration point , the maximum concentration point , and the concentration point at hours.
State the range of the concentration during the observed period.
Find the equation of the straight line connecting the initial concentration point and the concentration point at hours.
Show that the rate of change of the drug concentration is given by .
At a certain time, the rate of change of the drug concentration is parallel to the line AB. Find the equation of the tangent line to the graph of at this time. Give all coefficients in your equation correct to significant figures.
Calculate the area of the region enclosed by the graph of and the line AB.
To sketch the graph, first find the coordinates of the end-points of the interval and any local maximum or minimum points within the interval. For the maximum point, find the derivative of and set it to zero.
The range is determined by the minimum and maximum values of the function over the given interval. Refer to your calculated points from part (a).
Use the coordinates of points and to find the gradient of the line. Then use the point-slope form to write the equation of the line.
Use the product rule for differentiation: if , then .
If the tangent is parallel to line AB, their gradients must be equal. Set equal to the gradient of line AB found in part (c) and solve for . Then find the corresponding value to get the point of tangency.
The area enclosed by two curves and over an interval is given by . Determine which function is above the other and then perform the definite integration. You will need to use integration by parts for the term .
Question 11
MediumPaper 2 · calculator5 marksA scientist is modeling the growth of a certain bacterial colony. The population size, , at time hours, is given by the function for .
(a) On the following axes, sketch the graph of for .
Another bacterial colony, under different conditions, has its population size modeled by . It is observed that the growth curve of this second colony can be obtained from the graph of by a horizontal stretch with scale factor , followed by a vertical translation of units.
(b) Find the value of and the value of .
To sketch the graph accurately, identify key features such as the y-intercept, local minimum, and approximate roots. Also, calculate the function values at the endpoints of the given domain.
Recall that a horizontal stretch by a scale factor of transforms to . A vertical translation by units transforms to . Combine these transformations and compare the resulting expression with .
Question 12
HardPaper 2 · calculator15 marksThe rate of change of the concentration, , of a reactant in a chemical process at time is modelled by the differential equation , for . Given that the initial concentration is , use Euler's method with a step size of to find an approximate value of when .
Solve the differential equation using an appropriate analytical method, and find the exact value of when .
Sketch the approximate values you found in part (a) and the graph of the function you found in part (b) on the same coordinate axes. Use your sketch to explain why your answer in part (a) is greater than or less than the value in part (b).
Recall Euler's method formula: . Be careful with the calculations for each step.
Rearrange the differential equation into the standard form for a first-order linear differential equation, , and then use an integrating factor.
To explain the difference, consider the concavity of the analytical solution curve. Does Euler's method (which uses tangent lines) tend to overestimate or underestimate for that concavity?
Question 13
MediumPaper 2 · calculator8 marks(a) Using your GDC, sketch the curve of for . Clearly label any intercepts and the vertex.
(b) Write down the coordinates of the points where the curve intersects the x-axis and the y-axis. Give your answers correct to three significant figures.
(c) Write down the range of .
Remember to set your GDC window settings appropriately to view the specified domain and the key features of the parabola. Identify the vertex and intercepts before sketching.
To find x-intercepts, set y=0 and solve the quadratic equation. To find the y-intercept, set x=0.
Since the coefficient of the term is negative, the parabola opens downwards. The maximum value of the function is the y-coordinate of the vertex.
Question 14
HardPaper 3 · calculator27 marksA company is designing a new power generator. The power output, , in megawatts (MW), of a prototype generator at time hours after startup is modelled by the function , where , is a control parameter, and is a constant representing the initial power. For parts (a) to (e), assume .
On separate axes, sketch the graph of showing the value of the -intercept and the coordinates of any points with zero gradient, for
(i) ;
(ii) .
Write down an expression for .
Hence, or otherwise, find the set of values of such that the graph of has
(i) a point of inflexion with zero gradient;
(ii) one local maximum point and one local minimum point;
(iii) no points where the gradient is equal to zero.
Given that the graph of has one local maximum point and one local minimum point, show that
(i) the -coordinate of the local maximum point is ;
(ii) the -coordinate of the local minimum point is .
Hence, for , find the set of values of such that the graph of has
(i) exactly one -axis intercept;
(ii) exactly two -axis intercepts;
(iii) exactly three -axis intercepts.
Consider a modified power output function for and where . Find all conditions on and such that the graph of has exactly one -axis intercept, explaining your reasoning.
To sketch the graph, first find the derivative and set it to zero to find the critical points. Evaluate at these points to find the coordinates of local maxima and minima. Also, find the -intercept by setting .
Similar to part (a.i), find the critical points and their corresponding -values. Remember to use exact values where possible, and approximate for plotting if necessary.
Recall the power rule for differentiation.
A point of inflexion with zero gradient occurs when has a repeated root, which also implies at that point.
Local maximum and minimum points occur when has two distinct real roots.
No points with zero gradient means has no real solutions.
From part (c.ii), the critical points are . Determine which one corresponds to a local maximum by considering the shape of a positive cubic or using the second derivative test. Then substitute that -value into .
Similar to part (d.i), substitute the -value for the local minimum into .
For a cubic function with local maximum and minimum, it has exactly one -axis intercept if either the local minimum is above the -axis or the local maximum is below the -axis.
A cubic function with local maximum and minimum has exactly two -axis intercepts if either the local minimum is on the -axis or the local maximum is on the -axis.
A cubic function with local maximum and minimum has exactly three -axis intercepts if the local minimum is below the -axis AND the local maximum is above the -axis.
Consider two cases for : and . For , analyze the derivative . For , use the -coordinates of the local maximum and minimum points, similar to part (e).
Question 15
MediumPaper 2 · calculator4 marksA company models the cost per unit, , in thousands of dollars, of producing thousand units of a new gadget using the function for .
The revenue per unit, , in thousands of dollars, is modelled by the function .
(a) Use your GDC to plot the graphs of and on the same set of axes.
By considering the points of intersection, solve the equation , giving your answers correct to three significant figures.
Use the 'intersect' function on your GDC to find the coordinates of the points where the two graphs meet. Remember to round your final x-values to three significant figures.
Question 16
HardPaper 3 · calculator31 marksThis question explores the characteristics of a company's profit function, , where represents the number of units produced (in thousands), is the maximum production capacity (in thousands of units), with and .
For parts (a) and (b), consider the case where .
Consider .
Sketch the graph of , clearly indicating the values of any axes intercepts and the coordinates of any local maximum or minimum points.
Consider , where , .
Use your graphic display calculator to explore the graph of for:
- the odd values and ;
- the even values and .
Hence, copy and complete the following table:
Number of local maximum points | Number of local minimum points | Number of points of inflexion with zero gradient
---|---|---
and | |
and | |
Now consider where and , .
Show that .
State the three solutions to the equation .
Show that the point on the graph of is always above the horizontal axis.
Hence, or otherwise, show that , for .
By using the result from part (f) and considering the sign of , show that the point on the graph of is
(i) a local minimum point for even values of , where and ;
(ii) a point of inflexion with zero gradient for odd values of , where and .
Consider the graph of , where , and .
State the conditions on and such that the equation has four distinct solutions for .
For a quadratic function in the form , the x-intercepts are found by setting . The x-coordinate of the vertex is given by .
Pay close attention to the behaviour of the graph near the x-intercepts ( and ) and at the midpoint () for both odd and even values of . Use the 'Analyze Graph' features on your GDC.
Use the product rule for differentiation, , where and . Alternatively, consider rewriting as and using the chain rule.
Set each factor in the expression for to zero and solve for . Remember that .
Substitute into the original function and simplify the expression. Consider the properties of and .
Substitute into the expression for found in part (c) and analyze the sign of each factor. Remember and .
Calculate and determine its sign based on whether is even or odd. Then combine this with and to deduce the nature of the stationary point at .
Similar to part (g.i), evaluate for odd and compare its sign with .
Think about the shape of the graph and how a horizontal line would intersect it. The number of intersections depends on the parity of and the value of relative to the local extrema.
Question 17
MediumPaper 2 · calculator7 marksA manufacturing company models its production efficiency, , at time (in hours) after a new process is implemented, using the function , for .
(a) Sketch the graph of for . Clearly indicate any discontinuities.
(b) The company wants to understand the theoretical efficiency rate as time approaches zero, even though the model is strictly for . Find numerically.
First, simplify the expression for . Remember that the original function is undefined at , even if the simplified form is not. This will result in a specific type of discontinuity.
To find a limit numerically, evaluate the function for values of that are very close to 0, approaching from the positive side (since ). Observe the trend in the output values.
Question 18
HardPaper 3 · calculator28 marks(a) A cubic equation with real coefficients has roots and .
(i) Write down the third root.
(ii) Verify that the real part of the complex roots is 3.
(b) Let . Show that the line is tangent to the curve at the point .
(c) Sketch the curve and the tangent to the curve at point , clearly showing where the tangent crosses the -axis.
(d) Let a general cubic function be given by , where and .
(i) Show that .
(ii) Hence, or otherwise, prove that the tangent to the curve at the point intersects the -axis at the point .
(e) Deduce from part (d)(ii) that the complex roots of the equation can be expressed as .
(f) Consider a cubic function of the form . Given that and , and the -coordinate of the point of tangency is .
(i) Use this information to determine the roots of the corresponding equation for .
(ii) State the coordinates of the complex conjugate root with negative imaginary part, , in the Argand diagram.
(g) The point of inflection for the curve is denoted by .
(i) Show that the -coordinate of is . You are not required to demonstrate a change in concavity.
(ii) Hence describe numerically the horizontal position of point relative to the horizontal positions of the points and .
(h) Consider the special case where .
(i) Sketch the curve for and .
(ii) For and , state in terms of , the coordinates of points and .
For a polynomial equation with real coefficients, if a complex number is a root, its conjugate must also be a root.
The real part of a complex number is . Consider the two complex roots.
To show a line is tangent to a curve at a point, verify two conditions: first, the point lies on both the curve and the line. Second, the gradient of the curve at that point is equal to the gradient of the line.
Identify the real root of the cubic function and the -intercept of the tangent line. Note that is a positive cubic function.
Use the product rule for differentiation: if , then . Here, let and .
First, find the -coordinate of point , . Then, use the expression for from part (d)(i) to find the gradient of the tangent at , which is . Form the equation of the tangent line and find its -intercept.
Recall that the complex roots are . Use the relationship found in part (d)(ii) between and .
Use the formula for derived in part (d)(ii): . Substitute the given values to find , then identify all the roots.
The complex roots are of the form . The complex conjugate root with a negative imaginary part is . Its coordinates in the Argand diagram are .
The -coordinate of the point of inflection is found by setting the second derivative, , to zero. Use the expression for from part (d)(i) to find .
Point has -coordinate , and point has -coordinate . Express in terms of and to see its relative position.
Substitute and into the function. Analyze the derivative to determine if there are any stationary points and the point of inflection.
Use the formulas for the -coordinate of from (g)(i) and the -coordinate of from (d)(ii), substituting . Then find the -coordinate for as well.
Question 19
MediumPaper 2 · calculator17 marksA hot air balloon takes off from a launch platform. Its height above the ground, metres, minutes after takeoff, is modelled by the function .
Determine the height of the hot air balloon after 5 minutes and after 10 minutes.
Find an expression for the vertical velocity of the hot air balloon, , in terms of .
Calculate the time at which the hot air balloon reaches its maximum height.
Determine the total duration of the balloon's flight before it lands.
Sketch the graph of for the duration of the flight, clearly indicating the intercepts with the -axis and the coordinates of the maximum point. State the domain of the model.
Find the vertical velocity of the hot air balloon at the instant it lands.
Show that the vertical acceleration of the hot air balloon is constant, stating its value.
Substitute the given time values into the height function .
Recall that velocity is the first derivative of displacement (height) with respect to time.
The maximum height occurs when the vertical velocity is zero. Set and solve for .
The balloon lands when its height above the ground is zero. Set and solve for . Remember that is takeoff.
Use the information from parts (c) and (d) to identify key points for the sketch. The domain will be from takeoff to landing.
Use the time the balloon lands (from part d) and substitute it into the velocity expression (from part b).
Acceleration is the second derivative of height with respect to time, or the first derivative of velocity with respect to time.
Question 20
HardPaper 3 · calculator26 marksAn architect is designing a decorative archway for a garden entrance. The shape of the archway's inner curve is modelled by the equation , where and are in meters.
(a.i) On the same set of axes, sketch the curve for , clearly indicating any points of intersection with the coordinate axes. Assume a suitable range for and that shows the key features.
(a.ii) On the same set of axes, sketch the curve for , clearly indicating any points of intersection with the coordinate axes. Assume a suitable range for and that shows the key features.
(a.iii) By considering each curve from part (a), identify two key features that would distinguish from .
(b.i) For the curve , show that for .
(b.ii) Find the -coordinates of any local maximum or minimum points on .
(c) The curve has points of inflexion. Find the -coordinate of these points, giving your answer in the form where .
Consider a different archway design modelled by the curve , for .
(d.i) The point P(-1, -1) is a rational point on . Find the equation of the tangent to at P.
(d.ii) This tangent intersects at another rational point Q. Find the coordinates of Q, expressing each coordinate as a fraction.
(e) The point S(-1, 1) also lies on . The line [QS] intersects at a further point R. Determine the coordinates of R.
For , consider the domain of and the symmetry about the -axis. Identify where the curve intersects the axes.
For , factor out to find the -intercepts. Consider the domain and the symmetry.
Compare the intercepts, domains, and types of points (e.g., cusps) on each curve.
Use implicit differentiation with respect to . Remember that differentiates to . Then substitute for .
Local extrema occur where . Consider the numerator of the derivative.
Points of inflexion occur where . Differentiate implicitly again. Remember to substitute to eliminate .
First, find using implicit differentiation. Then, substitute the coordinates of P to find the gradient of the tangent. Use the point-slope form of a line.
Substitute the equation of the tangent into the equation of the curve . You will get a cubic equation. Since P is a point of tangency, its -coordinate will be a repeated root.
First, find the equation of the line passing through Q and S. Then, substitute this equation into the curve 's equation. You will get a cubic equation, and you already know two roots (from Q and S).
No question on this page matches those filters. Try another difficulty or paper.
11 more Sketching graphs questions in the app
Every answer is marked mark by mark, IB-style, and the AI tutor helps when you are stuck.
Where marks are lost
- Using your own wrong value after failing a "show that".
