Periodic functions (amplitude, period, shift, transformations): notes and practice questions
- A periodic function repeats at regular intervals (e.g., sine and cosine functions).
- General form: or :
- Amplitude: (vertical stretch/shrink).
- Period: (horizontal stretch/shrink).
- Horizontal shift: .
- Vertical shift: .
How it is examined
The modelling question: a tide or a wheel, find , , , from a maximum, a minimum and a period. is half the range and is the midline, and both are routinely swapped. comes from the period. Paper 2, 6 to 9 marks across parts.
- The circular functions , and ; amplitude, their periodic nature, and their graphs.
- Composite functions of the form .
- Transformations.
- Real-life contexts.
Linking questions
- Links to other subjects: simple harmonic motion (physics).
Practice questions
18 questions · 1 easy · 13 medium · 4 hardQuestion 1
EasyPaper 1 · no calculator3 marksThe function is transformed to the function by a horizontal stretch with a scale factor of 2, followed by a translation by the vector . Find the equation of the function .
Recall the rules for function transformations. A horizontal stretch by a factor of transforms to . A translation by a vector transforms to .
Question 2
MediumPaper 1 · no calculator7 marksConsider the functions and , where and .
The graph of is obtained by two transformations of the graph of .
Describe these two transformations.
The -intercept of the graph of is at .
Given that the maximum value of is less than or equal to 1, find the largest possible value of .
Look at how the input to the cosine function has changed, and how the entire function has been shifted vertically.
First, determine the maximum value of in terms of . Use the given condition to find the minimum possible value for . Then, calculate the y-intercept, , and use your result for to find the largest possible value of .
Question 3
HardPaper 1 · no calculator7 marksConsider the functions and , where and .
The graph of is obtained by two transformations of the graph of .
(a) Describe these two transformations.
The -intercept of the graph of is at .
(b) Given that the maximum value of is 1, find the value of .
Look at the changes inside the cosine function for the horizontal transformation and the changes outside the function for the vertical transformation. Remember the sign conventions for translations.
First, find the maximum value of the function in terms of . Use the given information that this maximum value is 1 to find the value of . Then, calculate the -intercept, , by evaluating .
Question 4
MediumPaper 2 · calculator5 marksA buoy is anchored in the ocean, and its vertical position is modeled by a trigonometric function. The buoy oscillates between a minimum height of 0.8 meters above the seabed and a maximum height of 3.2 meters above the seabed. It completes one full oscillation in 12 seconds.
The height, meters, of the buoy above the seabed after seconds is given by , where . The buoy starts its oscillation at its lowest point.
Find the values of , and .
Recall that the amplitude is half the difference between the maximum and minimum values. The vertical shift is the average of the maximum and minimum values. The period is related to 'b' by the formula . Pay attention to the starting point for the sign of 'a'.
Question 5
HardPaper 1 · no calculator10 marksThe depth of water, metres, in a harbour on a particular day is modelled by the function , for , where is the number of hours after midnight.
The graph of is shown below.
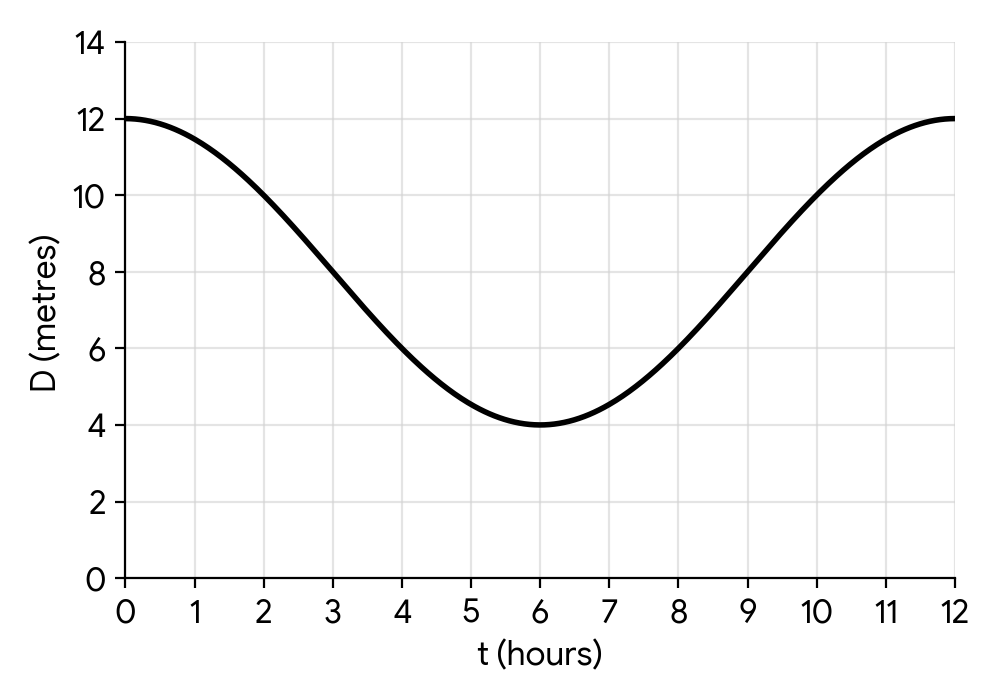
The graph has a maximum point at and a minimum point at .
(a) State:
i) the range of .
ii) the period of .
(b) Hence, find the values of , and .
(c) A ship requires a water depth of at least 10 metres to be able to enter the harbour. Find the time intervals, during the first 12 hours, when the ship can enter.
The range is the set of all possible output values (y-values), which for this graph is from the minimum depth to the maximum depth.
The period is the length of one full cycle. The time taken to go from a maximum to the next minimum is half a period.
The amplitude and the principal axis can be found from the maximum and minimum values. The parameter is related to the period.
Set up an inequality and solve for . First, solve the corresponding equation to find the boundary points of the intervals.
Question 6
MediumPaper 2 · calculator8 marksA rotating arm on an industrial machine has a sensor attached to its end. The arm is 8 metres long. The lowest point reached by the sensor is 2 metres above the ground. The arm completes one full rotation in 15 seconds.
At time seconds, the sensor is at its lowest point.
The height, metres, of the sensor above the ground after seconds is modelled by the function , where .
Find the values of , , and .
(b) Calculate the height of the sensor after 5 seconds.
(c) Find the first time, in seconds, when the height of the sensor is 7 metres.
Consider the amplitude as half the arm's length. The vertical shift relates to the lowest point and amplitude. The period of the function is the time for one full rotation.
Substitute into the function you found in part (a).
Set and solve for . Remember to find the principal value and then consider the general solutions within the first period.
Question 7
HardPaper 1 · no calculator12 marksThe graph shows the height of two floating platforms, Platform A and Platform B, in a wave pool over a 24-second interval. The height, metres, is measured from the bottom of the pool. Time is in seconds.
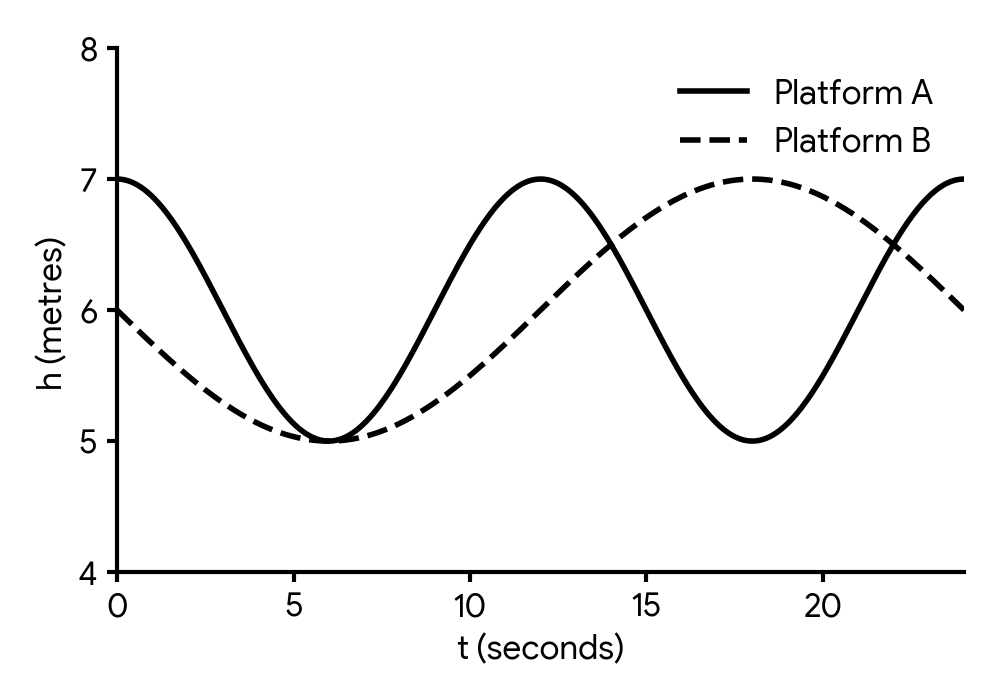
The height of Platform A is modelled by the function .
The height of Platform B is modelled by the function .
Find the values of and .
Solve the equation for .
For each function, identify the amplitude, period, and vertical shift (midline) from the graph. Remember that the sign of the amplitude ( or ) depends on the starting direction of the wave (max/min for cosine, increasing/decreasing for sine).
Set the two expressions for and equal to each other. You will need to use a double angle identity for cosine, , to transform the equation into a quadratic in terms of a single trigonometric function.
Question 8
MediumPaper 2 · calculator14 marksThe daily temperature, in degrees Celsius, in a coastal city is modelled by the function , where is the number of hours after midnight, and and are constants, where , and .
The following graph shows the temperature for a 24-hour period, starting at midnight.
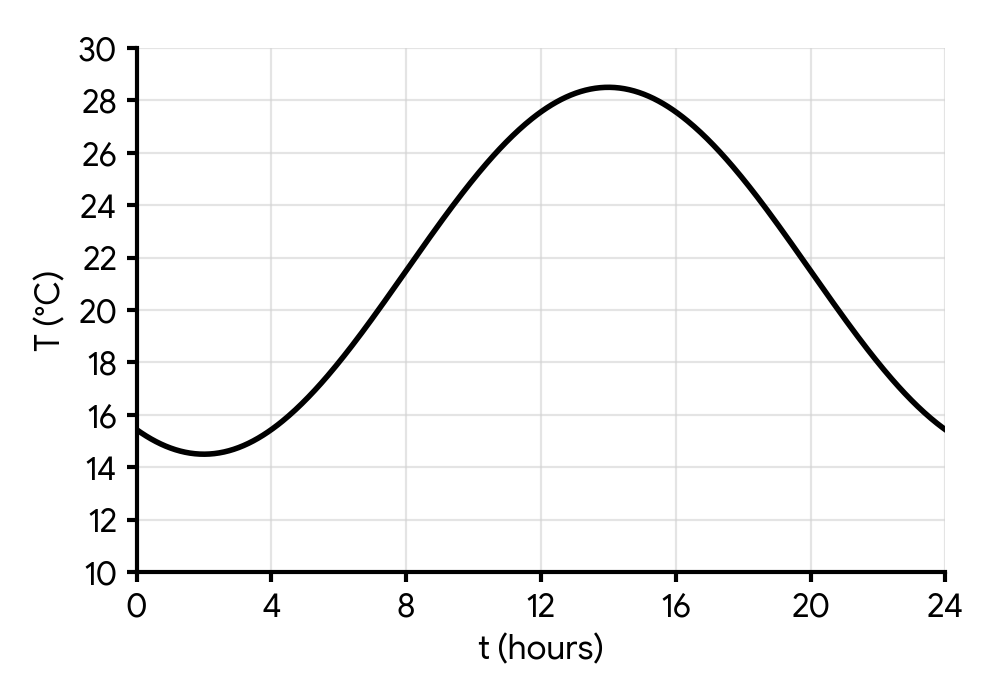
The first peak temperature occurs at 14:00 (2 PM) and the next peak temperature occurs 24 hours later. Throughout the day, the temperature fluctuates between 14.5 °C and 28.5 °C.
All temperatures are given correct to one decimal place.
Show that .
(b) Find the value of .
(c) Find the value of .
(d) Find the smallest possible value of .
(e) Find the temperature at 06:00 (6 AM).
(f) Determine the number of hours, over a 24-hour period, for which the temperature is higher than 25 °C.
The period of the sinusoidal function is the time between consecutive peaks. The formula relating the period (P) to the constant 'b' is .
The amplitude 'a' is half the difference between the maximum and minimum values of the function.
The vertical shift 'd' represents the midline of the sinusoidal function, which is the average of the maximum and minimum values.
The function reaches its first maximum when the argument of the sine function, , equals . Use the given time of the first peak.
Substitute into the full temperature function with the values of you found.
Set and solve for . Remember that the sine function has multiple solutions within a 24-hour period. You'll need to find the two times within one cycle when the temperature equals 25 °C, and then consider the full 24-hour period if necessary (though for a 24-hour period with a 24-hour cycle, one cycle is enough).
Question 9
HardPaper 3 · calculator25 marksThis question asks you to investigate the motion of a buoy bobbing up and down in the water.
A buoy bobs up and down in the water.
A fixed origin is the equilibrium position of the buoy (the water level).
The buoy's displacement, metres, from at time seconds is given by
Determine
the amplitude of the buoy's motion;
the buoy's initial displacement from ;
the value of when the buoy first passes through .
Now consider the general case of a buoy bobbing up and down.
The buoy's acceleration is always directed towards a fixed origin at its equilibrium position.
The buoy's acceleration, , at a displacement, , from satisfies the differential equation
The buoy's displacement, , from at time is given by
By finding expressions for and , verify that satisfies the differential equation .
Use the chain rule to show that , where is velocity.
By solving the differential equation, , show that .
Hence, or otherwise, find the buoy's maximum speed.
The continuous random variable denotes the buoy's displacement, , from at time .
The probability density function of is defined by
Show that .
For , the function can be expressed in the form , where and is the buoy's velocity at a displacement, , from .
Find the value of .
Determine , justifying your answer.
Interpret the result found in part (f)(i) in the context of the buoy's motion.
The amplitude is the maximum displacement from the equilibrium position, which corresponds to the coefficient of the sine function.
Initial displacement occurs when time . Substitute this into the displacement equation.
Passing through means the displacement . Solve the equation for the smallest positive value of .
Differentiate the displacement function with respect to twice to find the acceleration, then show it equals .
Start with the definition of acceleration and apply the chain rule by introducing .
Separate the variables and , then integrate both sides. Use the initial conditions or the properties of the motion (like when ) to find the constant of integration.
Consider the expression for . What value of will make as large as possible?
Set up a definite integral of the probability density function between the given limits. Use the standard integral result for .
Use the expression for found in part (c)(ii) to write in terms of , then substitute this into the given form for .
Consider the symmetry of the probability density function or the properties of the integral of an odd function.
What does the expected value of the displacement represent physically for the oscillating buoy?
Question 10
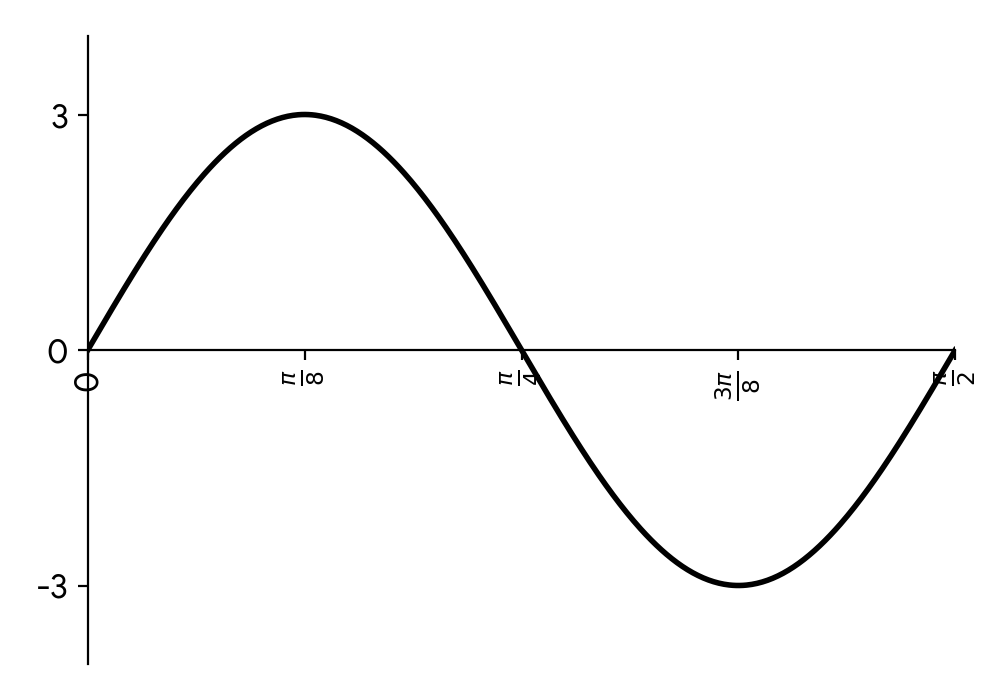
MediumPaper 1 · no calculator7 marksConsider the function , where are positive integers. The following diagram shows part of the graph of .
(a) Write down the value of .
(b) (i) Find the period of .
(b) (ii) Hence, find the value of .
(c) Find the value of .
The value of 'p' represents the amplitude of the sine function. Look at the maximum or minimum value of the function on the graph.
The period is the length of one full cycle of the function. Identify on the graph how long it takes for the function to repeat its pattern.
The period of a sine function of the form is given by the formula . Use the period you found in the previous part to solve for .
First, write down the full equation for using the values of and you have found. Then, substitute into the equation and evaluate. You will need to know the exact value of a standard trigonometric ratio.
Question 11
MediumPaper 2 · calculator15 marks(a) A new Ferris wheel is being constructed. From a point A on the ground, 15 metres from the base of the support tower, the angle of elevation to the centre C of the Ferris wheel is 33.7 degrees. Find the height of point C above the ground.
(b) An engineer walks 5 metres closer to the support tower to point B. Find the angle of elevation of point C from point B, giving your answer in radians.
(c) The lowest point a passenger cabin reaches is 1.5 metres above the ground, allowing for easy boarding. Calculate the radius of the Ferris wheel.
(d) The height , in metres, of a passenger cabin above the ground can be modelled by the function , where is the time in seconds after the cabin starts moving from its lowest point. The Ferris wheel completes one full rotation in 40 seconds.
Find the values of , , and .
(e) An observer watches the Ferris wheel for 5 minutes. How many times does a specific cabin pass its highest point during this time?
Recall the SOH CAH TOA rules for right-angled triangles. You are given the adjacent side and an angle, and you need to find the opposite side (height). Make sure your calculator is in degree mode for the given angle.
First, determine the new horizontal distance from point B to the base of the tower. Then, use the height of point C found in part (a) and the tangent function to find the new angle of elevation. Remember to convert your calculator to radian mode or convert the final answer to radians.
The radius of the Ferris wheel is the distance from the center (C) to the lowest point a cabin reaches. Consider the height of the center and the height of the lowest point.
For a trigonometric function of the form : is the amplitude (related to radius), is the vertical shift (related to the center height), and is related to the period by . Since the cabin starts at its lowest point, the negative cosine function is appropriate.
First, convert the total observation time into seconds. Then, determine how many full rotations occur within that time. Consider that the cabin starts at its lowest point at and reaches its highest point halfway through each rotation.
Question 12
MediumPaper 1 · no calculator5 marksThe vertical displacement, metres, of a weight oscillating on a spring at time seconds, is modelled by the function , where . The graph of for is shown below.
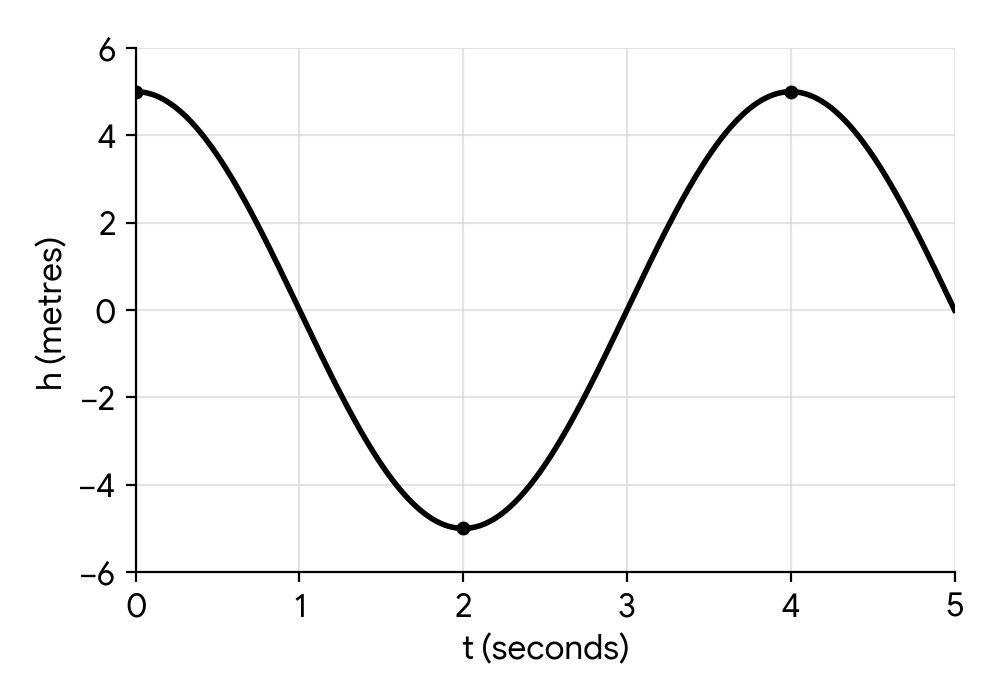
The graph has a maximum point at and a minimum point at .
(a) Find the period of the function.
(b) Write down the amplitude of the function.
(c) Write down the value of .
(d) Find the value of .
The period is the time it takes for the function to complete one full cycle. You can find this by looking at the horizontal distance between two consecutive maximum points or two consecutive minimum points.
The amplitude is half the vertical distance between the maximum and minimum values of the function.
The parameter in the function represents the amplitude. Check if the function is reflected vertically.
The period of a function of the form is given by the formula Period = . Use the period you found in part (a) to solve for .
Question 13
MediumPaper 1 · no calculator7 marksThe depth of water, metres, in a harbour is modelled by the function , where is the number of hours after midnight.
The graph below shows the depth of water over a 24-hour period.
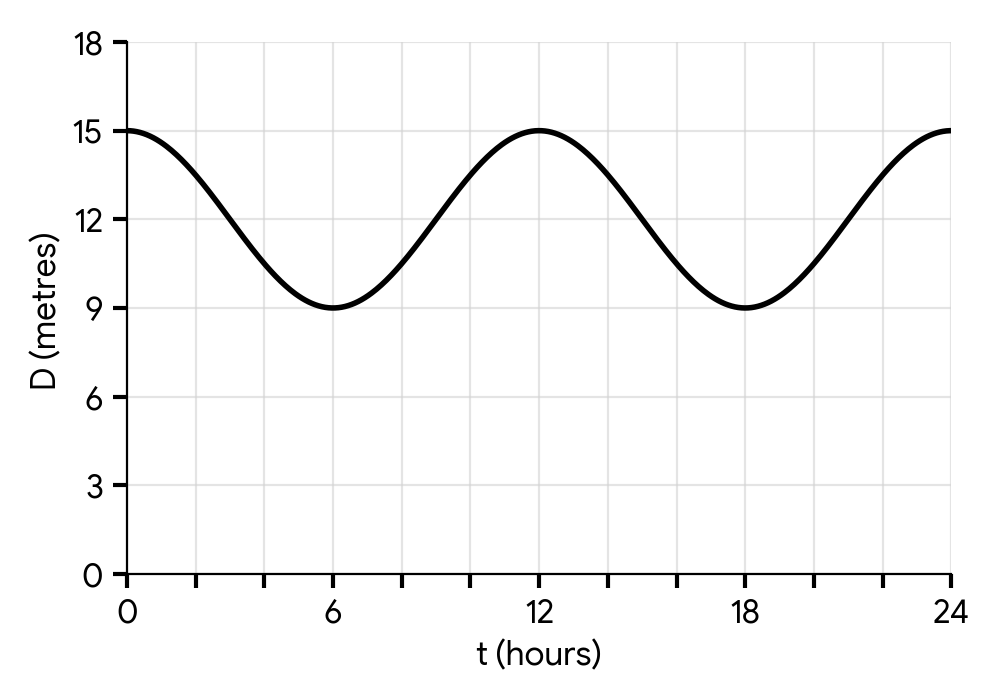
(a) Find the value of , the mean water level.
(b) Find the value of , the amplitude.
(c) Find the value of .
The mean water level, , is the vertical shift of the graph. It can be found by calculating the average of the maximum and minimum water depths.
The amplitude, , is half the difference between the maximum and minimum water depths. It can also be seen as the distance from the mean water level to a maximum or minimum point.
The parameter is related to the period of the function. First, determine the period from the graph by looking at the horizontal distance between two consecutive maximum or minimum points. Then, use the formula Period = .
Question 14
MediumPaper 2 · calculator6 marks(a) A scientist is modelling the population dynamics of a certain species of microorganism in a controlled environment. The growth rate is modelled by the function , where is time in hours. Simultaneously, a decay factor due to a limited nutrient supply is modelled by . The scientist is interested in finding the time when the growth rate equals the decay factor within the first hours of the experiment.
Use a sketch to help you solve for .
(b) An engineer is designing a new component where two critical dimensions, represented by functions and , must be equal for optimal performance. The variable represents a design parameter, and its valid range is .
Solve for .
Graph both functions, and , on your GDC within the specified domain. Look for their intersection point.
Enter and into your GDC and find their intersection point within the given domain.
Question 15
MediumPaper 1 · no calculator10 marksThe height, metres, of a passenger on a Ferris wheel minutes after the ride starts is given by . The ride starts at when the passenger is at the lowest point. The lowest point is 1 metre above the ground. The diameter of the wheel is 20 metres. The wheel completes one revolution in 16 minutes.
(a) Find the maximum height reached by the passenger and hence find the value of .
(b) Find the value of .
(c) Show that .
(d) The function is transformed to a new function . The graph of is first translated by the vector and then reflected in the -axis. Find the equation of .
The maximum height is the lowest point plus the diameter. The value of is the vertical shift, which is the midline between the maximum and minimum heights.
The value of is the amplitude. However, consider the starting position of the passenger. The ride starts at the lowest point at . Use this information with the general form of the function to determine the sign of .
The value of is related to the period of the function. The period is the time it takes for one full revolution. Use the formula Period .
First, write down the full equation for . Then apply the transformations one by one. A translation by transforms to . A reflection in the x-axis (or t-axis here) transforms to .
Question 16
MediumPaper 1 · no calculator15 marksThe height, metres, of a passenger on a Ferris wheel at time seconds, is modelled by the function , for . The graph of for the first two revolutions is shown below.
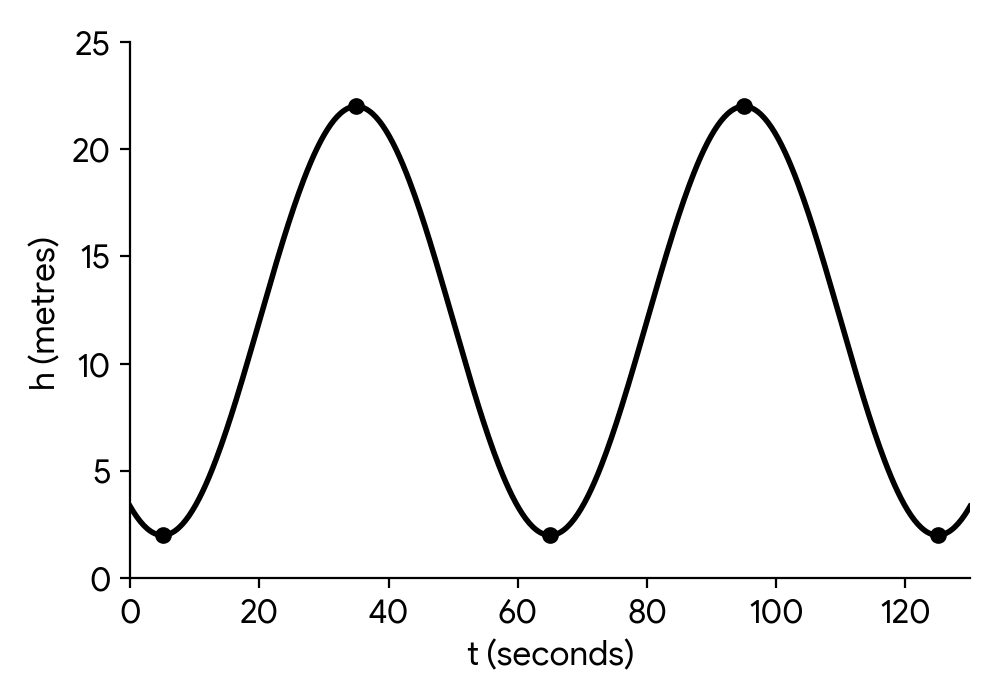
(a) Write down the maximum and minimum height of the passenger.
(b) Find the time it takes for the Ferris wheel to complete one full revolution.
(c) Find the value of and the value of .
(d) Show that .
(e) Find a possible value for .
(f) During the first two revolutions shown on the graph, find the times when the passenger is at a height of 7 metres.
The maximum and minimum heights correspond to the highest and lowest points on the graph. Look at the y-values of these points.
One full revolution corresponds to one full period of the function. Find the horizontal distance between two consecutive minimum points or two consecutive maximum points on the graph.
The parameter represents the vertical shift, or the midline of the graph. It can be calculated as the average of the maximum and minimum values. The parameter represents the amplitude, which is half the difference between the maximum and minimum values. Pay attention to the sign of based on the shape of the graph.
The parameter is related to the period of the function. Use the formula Period .
The parameter represents the horizontal shift. Use the coordinates of a known point on the graph, such as a minimum or maximum, and substitute them into the function equation to solve for .
Set up the equation using the function you have found. Solve for . Remember that the cosine function is periodic, so there will be multiple solutions. Find all solutions within the time interval for the first two revolutions.
Question 17
MediumPaper 1 · no calculator11 marksThe height, metres, of a passenger on a Ferris wheel at time minutes after the ride starts is modelled by the function , for .
The graph of for the first revolution is shown below.
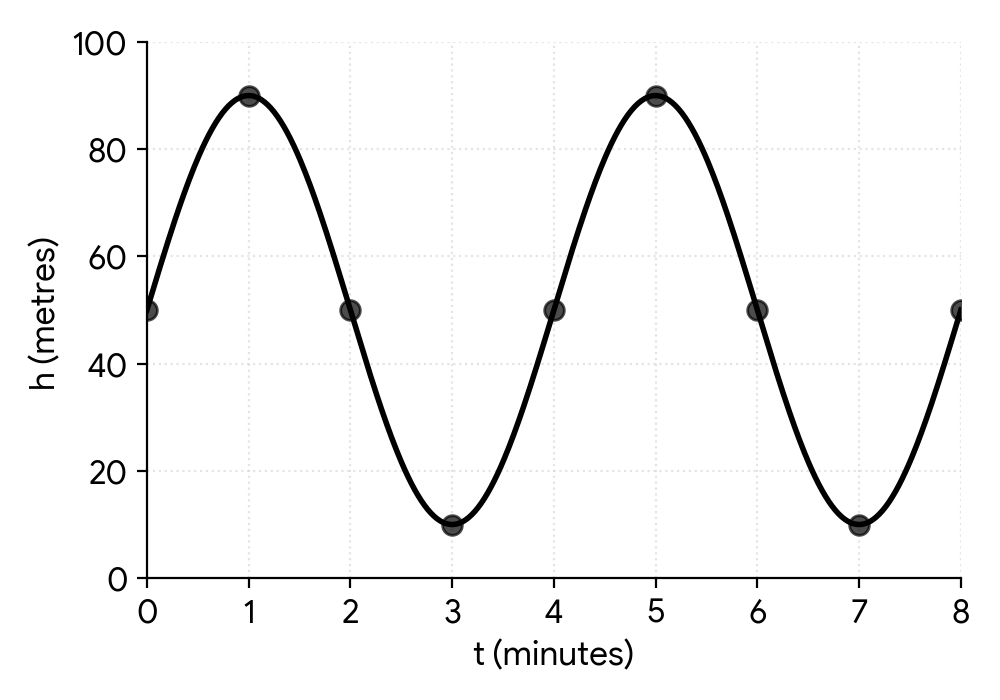
The graph shows a maximum point at and a minimum point at .
(a) (i) Write down the range of .
(a) (ii) Find the period of .
(b) Hence, find the values of and .
(c) Find the times during the first 8 minutes when the passenger is at a height of 70 metres.
The range of a function is the set of all possible output values (in this case, heights). Look at the minimum and maximum heights given in the problem description or on the graph.
The period is the time it takes for the function to complete one full cycle. The time between a maximum point and the next minimum point is exactly half a period.
Use the information from part (a). The parameter 'c' represents the vertical shift (the midline of the graph), 'a' is the amplitude, and 'b' is related to the period by the formula Period .
Set up the equation using the function with the parameter values you found in part (b). Solve this trigonometric equation for . Remember that the sine function is periodic, so you will need to find all solutions within the given domain .
Question 18
MediumPaper 2 · calculator19 marksThe intensity of light, , emitted by a pulsating star is modelled by the function , where is time in seconds.
(a) Sketch the graph of for . Clearly label any maximum and minimum points and the -intercept.
(b) (i) Find the coordinates of all minimum and maximum points of in the given domain .
(ii) State the range of .
(iii) State the -intercept of the graph of .
(c) The total light energy emitted by the star during a time interval is given by the area under the curve of .
(i) Write down an expression for the total light energy emitted by the star during the first seconds.
(ii) Hence, determine the total light energy emitted by the star during the first seconds.
(d) Show that the light intensity is always positive for all .
Consider the range of the inner function and how it affects the value of . Identify the period and key points like maximums, minimums, and the -intercept to help with your sketch.
The maximum value of is and the minimum value is . Determine the values of for which results in these extreme values for the cosine function.
The range of a function is determined by its minimum and maximum values. Refer to your findings from part (b)(i).
The -intercept occurs when . Substitute into the function .
The area under a curve is found using a definite integral. Identify the correct limits of integration based on the given time interval.
Use your GDC to evaluate the definite integral you set up in part (c)(i). Ensure your calculator is in radian mode.
Consider the range of the inner function , then the range of , and finally the range of . Use this to determine the overall minimum value of .
No question on this page matches those filters. Try another difficulty or paper.
Every Periodic functions (amplitude, period, shift, transformations) question, marked for you
Every answer is marked mark by mark, IB-style, and the AI tutor helps when you are stuck.
Where marks are lost
- Using your own wrong value after failing a "show that".
