Solving equations [f(x)=0 or f(x)=g(x)] (graphically, analytically, GDC): notes and practice questions
- Solve : Find roots/zeros where the graph intersects the x-axis.
- Solve : Find intersections of the two functions.
- Methods:
- Graphical: Use a GDC to plot and identify intersections.
- Analytical: Algebraic manipulation or factoring.
- Numerical (GDC): Use root-finding tools.
How it is examined
The disguised-quadratic (, or the same shape in ) is the Paper 1 version and needs the substitution shown. On Paper 2 the equation is one a GDC solves, and the marks are for setting it up and for giving every solution in the stated interval. 4 to 6 marks.
- Solving equations, both graphically and analytically.
- Use of technology to solve a variety of equations, including those where there is no appropriate analytic approach.
- Applications of graphing skills and solving equations that relate to real-life situations.
HL students may be required to use technology to solve equations where there is no appropriate analytic approach (stated in the AHL preamble to topic 2).
Linking questions
- Other contexts: radioactive decay, population growth and decay, compound interest, projectile motion, braking distances.
Practice questions
113 questions · 1 easy · 72 medium · 40 hardQuestion 1
EasyPaper 1 · no calculator5 marksA function is defined by , for .
(a) The graph of has a horizontal asymptote with equation . Write down the value of .
(b) The graph of has an -intercept at . Find the value of .
(c) Find the coordinates of the -intercept of the graph of .
The horizontal asymptote of a function of the form is given by the line . Compare this general form to the given function .
An -intercept at means the graph passes through the point . Substitute these coordinates into the function's equation, along with the value of you found in part (a). Then, solve for .
The -intercept occurs where the graph crosses the -axis. What is the value of at this point? Substitute this value of into the function's equation using the values of and you have found.
Question 2
MediumPaper 2 · calculator6 marksConsider the function , for .
Show that is an odd function.
The function is given by , where .
Solve the inequality .
To show a function is odd, you need to test the definition . Substitute into the function and simplify the expression to show it is equal to .
This is a calculator question. Graph both and on your GDC. Find the points of intersection. Then, identify the intervals on the x-axis where the graph of is on or above the graph of . Don't forget to consider the vertical asymptotes of at and .
Question 3
HardPaper 2 · calculator6 marksConsider the function , for .
(a) Show that is an odd function.
The function is given by , where .
(b) Solve the inequality .
Recall the definition of an odd function, . Substitute into the function and use the properties of logarithms, specifically , to simplify the expression.
Use your graphical display calculator to plot both and . Find all points of intersection. Identify the intervals on the x-axis where the graph of is on or above the graph of . Pay close attention to the domain of and the vertical asymptotes of .
Question 4
MediumPaper 1 · no calculator7 marksConsider the functions and where .
(a) Find .
The graphs of and have a common tangent at the point where .
(b) Show that .
(c) Hence, find the value of .
To find the derivative of , you can use the power rule for differentiation.
For two functions to have a common tangent at a specific point, their gradients must be equal at that point. Start by finding the derivative of and then set .
If the functions have a common tangent at a point, they must also pass through that same point. This means their y-values are equal at . Set and use the value of you found in part (b).
Question 5
HardPaper 3 · calculator24 marksA biologist is modelling the growth of two different bacterial colonies. The first colony, A, grows such that its population at time is given by , where is a growth factor and . The second colony, B, grows linearly such that its population at time is .
Consider the cases where the growth factor and . On the same set of axes, sketch the following three graphs for :
Clearly label each graph with its equation and state the coordinates of any non-zero -axis intercepts.
In parts (b) and (c), consider the case where the growth factor .
Use calculus to find the minimum value of the expression , justifying that this value is a minimum.
Hence deduce that for all .
There exist values of for which the graph of and the line have different numbers of intersection points. The following table gives three intervals for the value of .
| Interval | Number of intersection points |
|---|---|
By investigating the graph of for different values of , write down the values of and .
In parts (e) and (f), consider .
For , a value of exists such that the line is a tangent to the graph of at a point P.
Find the exact coordinates of P and the exact value of .
Write down the exact set of values for such that the graphs of and have
(i) two intersection points;
(ii) no intersection points.
Ensure your sketch accurately reflects the general shape and relative positions of exponential functions with different bases and the line . Pay attention to intercepts and asymptotic behaviour.
Recall how to find local extrema using calculus by analyzing the first and second derivatives.
Consider the implications of the minimum value found in part (b) for the expression .
Visualize how the graph of changes as the value of changes, especially relative to the line . Consider the general shapes for and .
For tangency, both the function values and their derivatives must be equal at the point of contact. Let the point of tangency be .
Relate the critical value of found in part (e) to the number of intersection points. Consider the graphical behavior.
Relate the critical value of found in part (e) to the number of intersection points. Consider the graphical behavior.
Question 6
MediumPaper 1 · no calculator7 marksThe function is defined by for , .
(a) Find the zero of .
(b) For the graph of , write down the equation of
(i) the vertical asymptote;
(ii) the horizontal asymptote.
(c) Find , the inverse function of .
To find the zero of a function, you need to find the value of for which the function's output is zero. For a rational function, when is the fraction equal to zero?
A vertical asymptote occurs where the function is undefined. For a rational function, where does this happen?
Consider the behavior of the function as approaches positive or negative infinity. What value does the function approach?
To find the inverse function, start by writing . Then, interchange the roles of and and solve the resulting equation for .
Question 7
HardPaper 1 · no calculator9 marksA function is defined by , where .
The graph of is shown below.
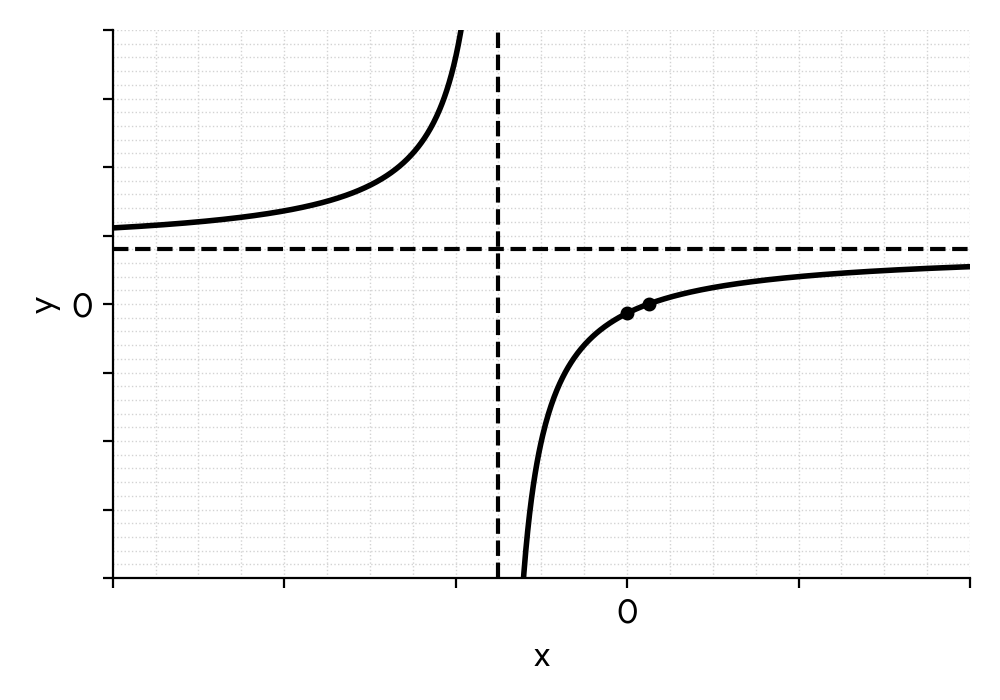
(a) Write down the equation of the horizontal asymptote.
Consider the function , where .
(i) Write down the number of solutions to for .
(ii) Determine the value of such that has only one solution for .
(iii) Determine the range of values for for which has two distinct solutions for .
The horizontal asymptote is determined by the behavior of the function as approaches . For a rational function where the degree of the numerator and denominator are the same, the asymptote is the ratio of the leading coefficients.
The line passes through the y-intercept of . Sketch a line with a negative slope passing through this point on the given graph. How many times does it intersect the curve ?
A single solution occurs when the line is tangent to the curve . Since the line always passes through the y-intercept of the curve, the point of tangency must be the y-intercept. Therefore, the slope of the line, , must be equal to the gradient of the curve at that point. Alternatively, you can set up the equation , rearrange it into a quadratic, and use the discriminant or analyze the roots.
From the previous part, you found the two solutions for in terms of . One solution is always . For there to be two distinct solutions for , what condition must the other solution satisfy?
Question 8
MediumPaper 1 · no calculator13 marksThe functions and are defined by
, where
, where .
The graphs of and intersect at two distinct points.
(a) State the equation of the vertical asymptote to the graph of .
(b) (i) Show that, at the points of intersection, .
(b) (ii) Hence show that .
(b) (iii) Find the range of possible values of .
The graphs intersect at and , where .
(c) In the case where , find the value of . Express your answer in the form , where .
The vertical asymptote of a logarithmic function occurs where the argument is equal to zero.
Set and use the properties of logarithms to simplify the equation. Remember the power rule: .
The condition 'two distinct points of intersection' means the quadratic equation from part (b.i) must have two distinct real roots. What does this imply about the discriminant?
Solve the quadratic inequality found in part (b.ii). Remember to consider the given domain for .
Substitute into the quadratic equation from part (b.i). Solve this equation to find the values of and . Then calculate their difference.
Question 9
HardPaper 1 · no calculator14 marksA function is defined by . The following diagram shows part of the graph of .
The graph has a vertex at V and intersects the y-axis at point P.
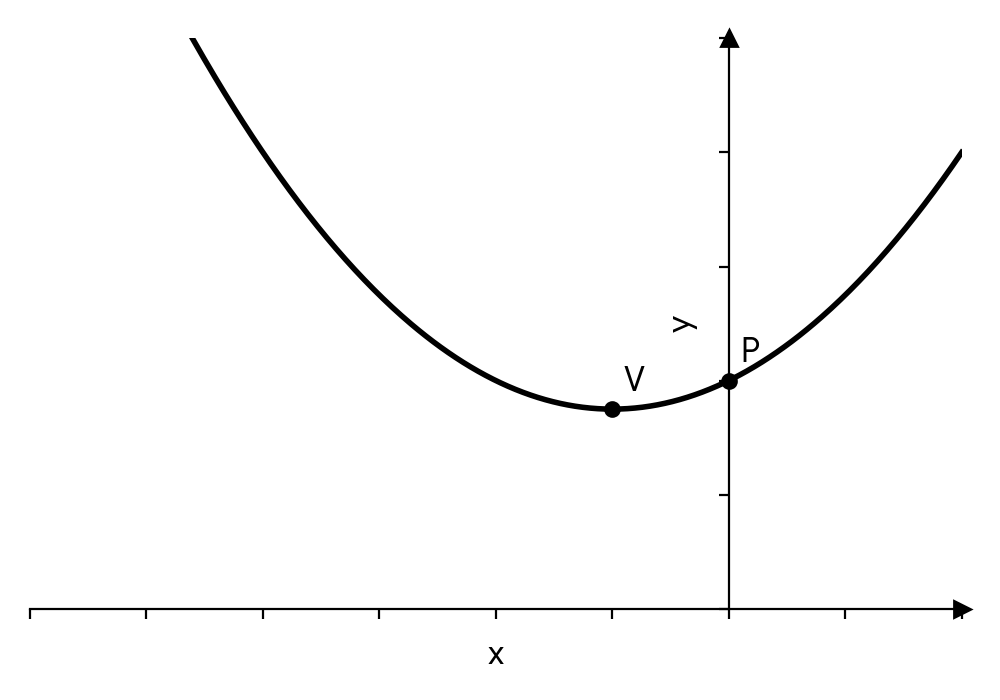
(a) Find the coordinates of the vertex V.
(b) Write down the coordinates of the y-intercept, P.
(c) The line L is the normal to the graph of at point P. Find the equation of L, giving your answer in the form .
(d) The line L intersects the graph of at a second point, Q. Calculate the distance between P and Q.
The x-coordinate of the vertex of a parabola can be found using the formula . Alternatively, you can find the derivative and solve for . Once you have the x-coordinate, substitute it back into the function to find the y-coordinate.
The y-intercept of a graph occurs when the x-coordinate is 0. Substitute into the function .
First, find the derivative of . Then, evaluate the derivative at the x-coordinate of P to find the gradient of the tangent. The gradient of the normal is the negative reciprocal of the tangent's gradient. Finally, use the point-slope form to find the equation of the line.
To find the coordinates of Q, set the equation for the function equal to the equation for the line L and solve the resulting quadratic equation for x. One solution will be the x-coordinate of P. The other will be for Q. Substitute this new x-value back into either equation to find the y-coordinate of Q. Finally, use the distance formula.
Question 10
MediumPaper 1 · no calculator15 marksConsider the function defined by .
Find the -intercepts of the graph of .
The graph of for is shown below. The graph encloses two regions with the -axis, shaded in the diagram.
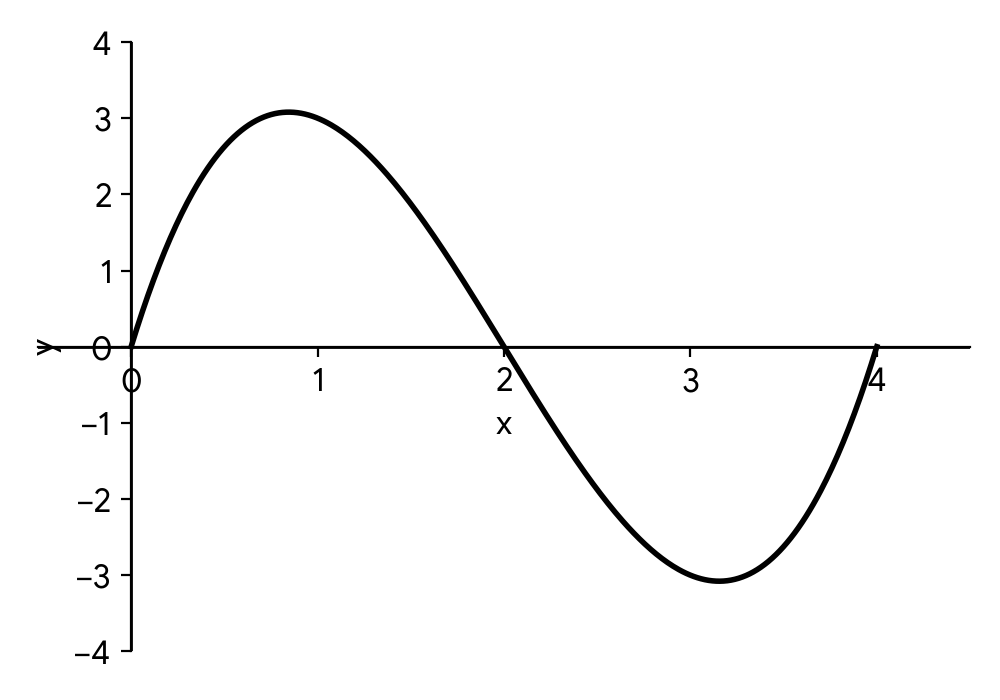
Find the total area of the shaded regions.
The total surface area of a closed right cylinder is 8, equal to the total shaded area found in part (b). The cylinder has a height of .
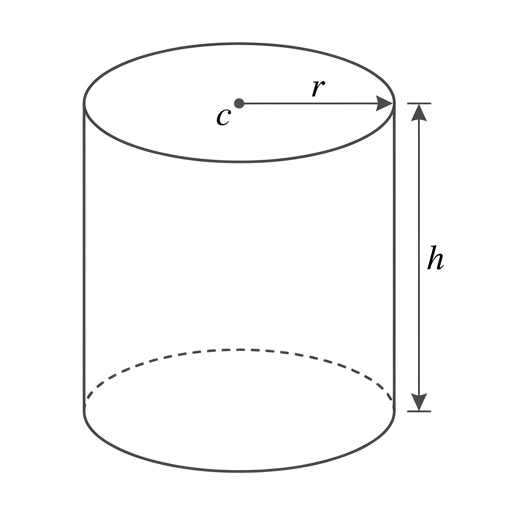
Find the radius, , of the cylinder.
Hence, find the volume of the cylinder.
To find the x-intercepts, you need to solve the equation . Look for a common factor first, then factorize the remaining quadratic.
The total area is the sum of two separate definite integrals. Remember that area must be positive, so you may need to take the absolute value of one of the integrals.
The formula for the total surface area of a closed cylinder is . Set this equal to the area you found, substitute the given height, and solve the resulting quadratic equation for .
The formula for the volume of a cylinder is . Use the values of and you now have.
Question 11
HardPaper 1 · no calculator15 marksThe functions and are defined by
, where
, where .
(a) State the equation of the vertical asymptote to the graph of .
The graphs of and intersect at two distinct points.
(i) Show that, at the points of intersection, .
(ii) Hence show that .
(iii) Hence, or otherwise, find the range of possible values of .
The following diagram shows part of the graphs of and .
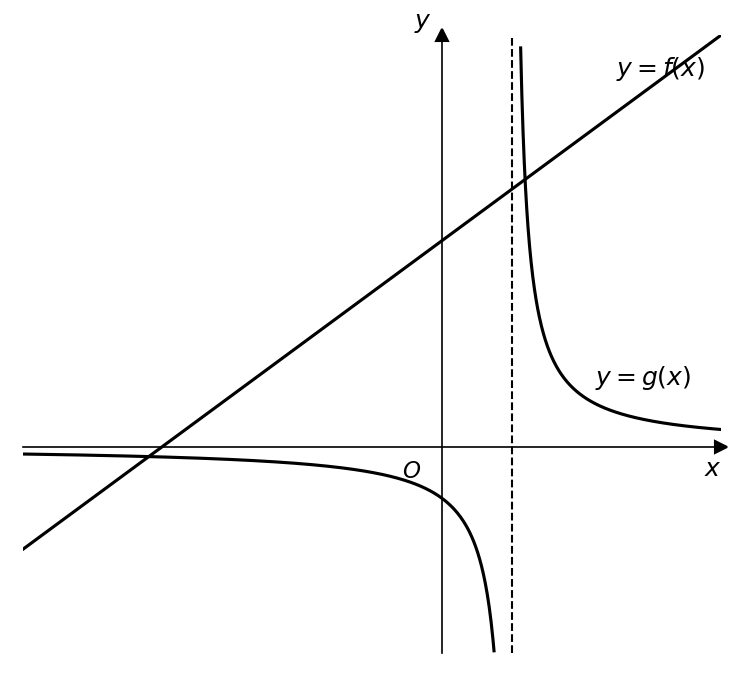
The graphs intersect at and , where .
In the case where , find the value of . Express your answer in the form , where .
A vertical asymptote occurs where the function is undefined. For a rational function of the form , this happens when the denominator is equal to zero.
The points of intersection are where the two functions are equal. Set and rearrange the equation into the required quadratic form.
The phrase 'two distinct points' tells you something about the discriminant of the quadratic equation you found in part (b.i). What is the condition for a quadratic to have two distinct real roots?
You need to solve the inequality . Consider the properties of this quadratic in . Does it ever equal zero? What is its minimum value? You could try finding the discriminant of this new quadratic or completing the square.
First, substitute the given value of into the quadratic equation from part (b.i). Then, solve this new quadratic equation to find the x-coordinates of the intersection points, and . Finally, calculate the difference .
Question 12
MediumPaper 1 · no calculator8 marksThe functions and are defined by and , for .
The curves and intersect at a point P whose x-coordinate is .
Show that .
Hence, show that the tangent to the curve at P and the tangent to the curve at P are perpendicular.
Find the value of . Give your answer in the form , where and .
At the point of intersection, the y-values of the two functions are equal. Use a trigonometric identity for .
Find the derivatives of both functions. To show that two lines are perpendicular, what must be true about the product of their gradients?
Use the result from part (a) and the Pythagorean identity to form a quadratic equation in terms of .
Question 13
HardPaper 1 · no calculator9 marksThe graph of the function and the line with equation are shown in the diagram below. The graphs intersect at the origin O, and at points A and B.
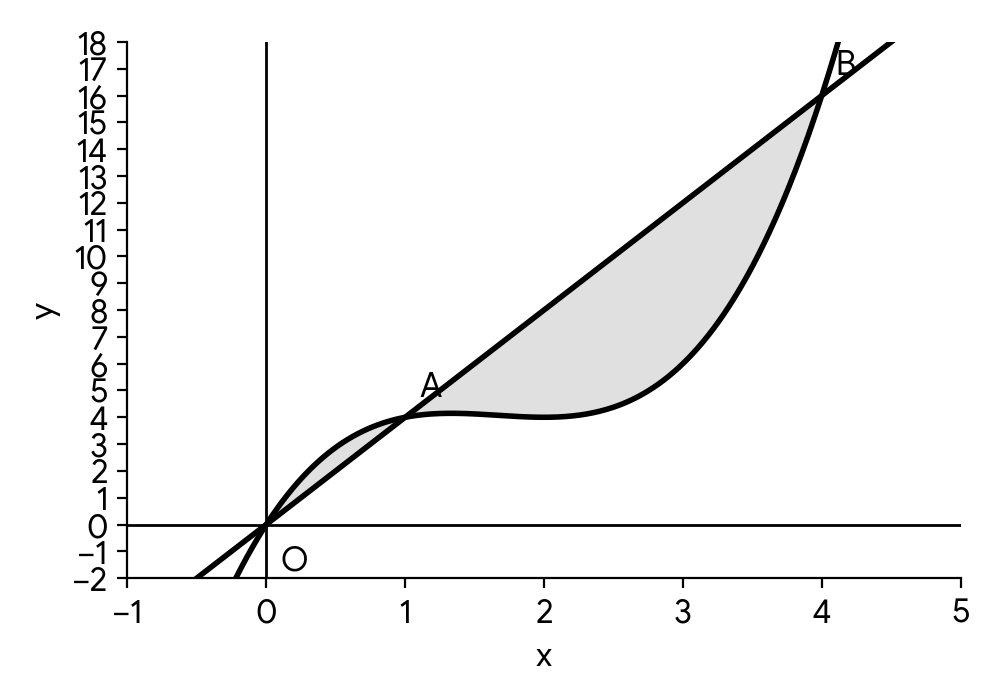
(a) Find the coordinates of A and B.
(b) The region enclosed by the graph of and the line is composed of two smaller regions. Find the total area of these two enclosed regions.
To find the points of intersection, you need to solve the two equations simultaneously. Set equal to the equation of the line .
The total area is the sum of the areas of the two separate regions. You will need to set up two definite integrals. Be careful to identify which function is the 'upper' function in each region.
Question 14
MediumPaper 1 · no calculator7 marksConsider the functions and where .
The graphs of and have a common tangent at .
(a) Find .
(b) Show that .
(c) Hence, find the value of .
Recall the rule for differentiating a natural logarithm function, and apply the chain rule.
For two functions to have a common tangent at a point, their gradients must be equal at that point. Set the derivatives of and equal to each other at .
For the functions to have a common tangent, they must also pass through the same point. This means their y-values are equal at . Set and substitute the value of you found in part (b).
Question 15
HardPaper 2 · calculator16 marksConsider the function f defined by for .
The graph of f and the line intersect at point P.
Find the x-coordinate of P.
The line L has a gradient of -2 and is a tangent to the graph of f at the point Q.
Find the exact coordinates of Q.
Show that the equation of L is .
The shaded region A is enclosed by the graph of f and the lines and L.
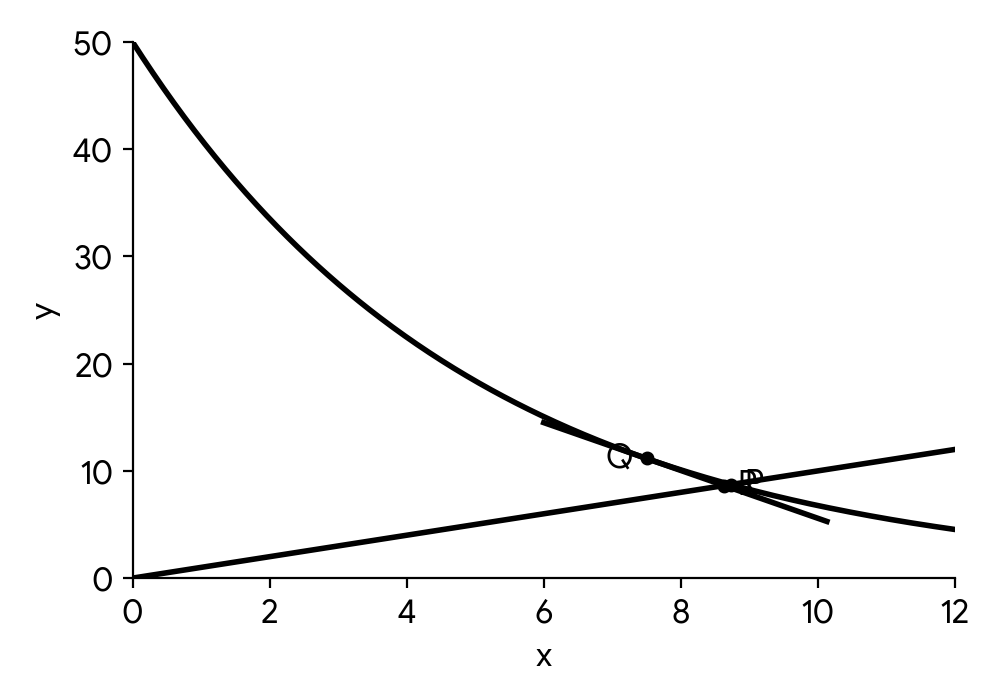
Find the x-coordinate of the point where L intersects the line .
Hence, find the area of A.
The line L is tangent to the graphs of both f and the inverse function .
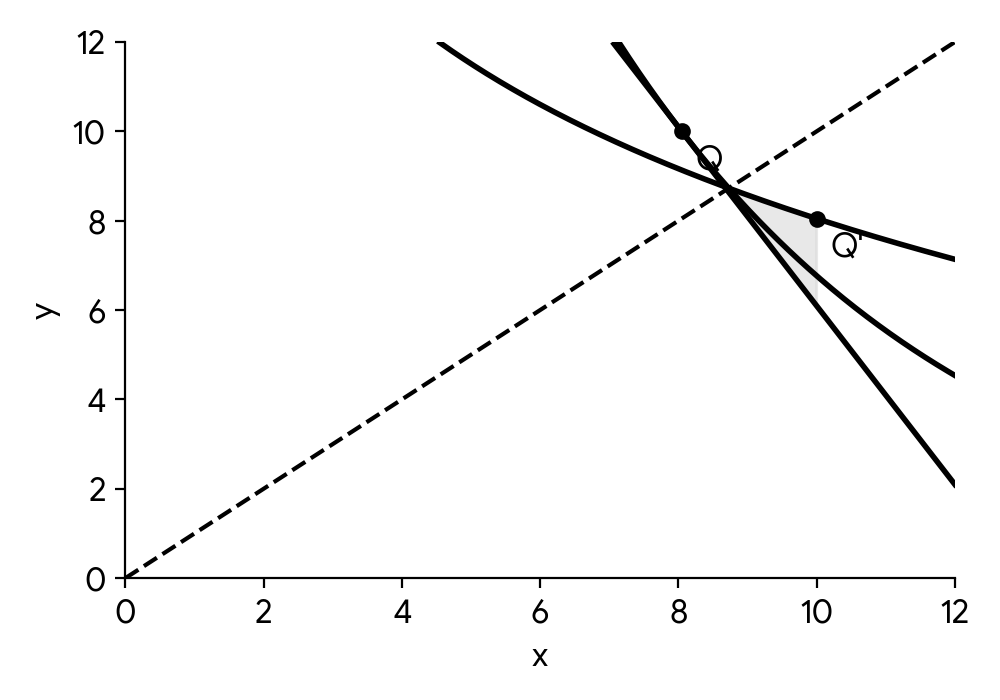
Find the shaded area enclosed by the graphs of f and and the line L.
To find the x-coordinate of P, you need to solve the equation . This is a transcendental equation, so a GDC will be useful to find the numerical solution.
First, find the derivative of . Then, set the derivative equal to the given gradient to find the x-coordinate of Q. Substitute this x-value back into to find the y-coordinate. Remember to provide exact values.
Use the point-gradient form of a line: , with the coordinates of Q and the gradient of L.
Set the equation of line L equal to and solve for x.
The area can be found by splitting it into two integrals. Identify the upper and lower bounding functions and the correct limits of integration based on the intersection points found in previous parts.
The graphs of a function and its inverse are symmetric about the line . How does this relate to the area calculated in part (d.ii)?
Question 16
MediumPaper 1 · no calculator9 marksConsider the function f defined by for .
The following diagram shows part of the graph of f which crosses the x-axis at point A, with coordinates . The line L is the tangent to the graph of f at the point B.
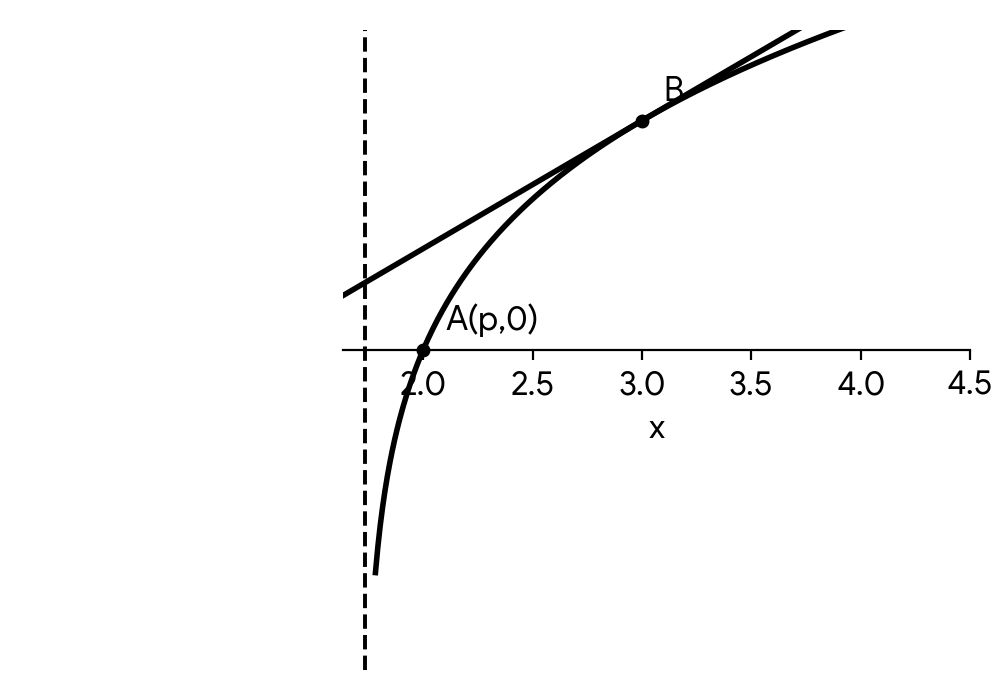
(a) Find the exact value of .
(b) Given that the gradient of L is , find the x-coordinate of B.
To find the x-intercept, you need to solve the equation . Remember the property that if , then .
First, you need to find the derivative of the function . Then, set the derivative equal to the given gradient and solve the resulting equation for .
Question 17
HardPaper 2 · calculator20 marksThe rate of change of a certain quantity with respect to a variable is given by , , , where is a positive constant.
The expression for can be written in the form , where .
Find and in terms of .
Hence, find an expression for .
The concentration of a certain chemical product, (in mol/L), in a reaction vessel at time (in minutes) can be modelled by the differential equation , where is the maximum possible concentration and mol/L is the initial concentration.
By solving the differential equation, show that .
At minutes, the concentration of the product has reached mol/L.
Find the value of , giving your answer correct to four significant figures.
Find the value of when the rate of change of the concentration is at its maximum.
To find and , combine the partial fractions on the right side by finding a common denominator. Then, equate the numerator of this combined expression to the numerator of the original expression for . You can then either compare coefficients of and the constant terms, or substitute specific convenient values for (like and ) to solve for and .
Integrate the partial fraction form of that you found in part (a). Remember that the integral of is and that you might need to use a substitution for terms like . Don't forget the constant of integration.
This is a separable differential equation. Separate the variables and , then integrate both sides. You can use the partial fraction decomposition from part (a) to integrate the terms. After integrating, apply the initial condition to solve for the constant of integration and then rearrange the equation to match the required form.
Substitute the given values for and into the formula derived in part (c). You will then have an equation with only as an unknown. Use your GDC to solve for .
For a logistic growth model, the rate of change is maximized when the quantity (concentration in this case) reaches half of its carrying capacity (maximum value ). Use the value of found in part (d) to determine this critical concentration, then substitute it back into the formula from part (c) to solve for .
Question 18
MediumPaper 1 · no calculator7 marksThe function is defined by for .
(a) Find the zero of .
(b) For the graph of , write down the equation of
(i) the vertical asymptote;
(ii) the horizontal asymptote.
(c) Find , the inverse function of .
To find the zero of a function, you need to find the value of for which the function's output is zero. For a rational function, this occurs when the numerator is equal to zero.
The vertical asymptote of a rational function occurs at the x-value(s) for which the denominator is zero, provided the numerator is not also zero at that x-value.
For a rational function where the degree of the numerator and the denominator are the same, the horizontal asymptote is the line .
To find the inverse function, start by writing the function as . Then, swap the variables and . Finally, rearrange the equation to make the subject. This new expression for is the inverse function.
Question 19
HardPaper 2 · calculator15 marksAll answers in this question should be given to four significant figures.
A popular online game offers players a 'Mystery Box' for £5. Each box contains a prize, with the probability distribution for the prize value shown in the following table. For example, the probability of a player receiving £ is 0.04. The initial grand prize in the first week of the game is £.
| 0 | 0.75 |
| 5 | |
| 25 | 0.04 |
| 100 | 0.005 |
| Grand Prize | 0.0002 |
(a) Find the value of .
(b) Determine whether purchasing a mystery box in the first week is a fair game. Justify your answer.
(c) If the grand prize is not won and continues to triple each week, while all other prize amounts and probabilities remain the same, write an expression in terms of for the value of the grand prize in the th week of the game.
(d) The th week is the first week in which a player is expected to make a profit from purchasing a mystery box. If a player purchases a mystery box in the th week, their expected profit is .
Find the value of .
Remember that the sum of all probabilities in a probability distribution must equal 1.
A game is considered fair if the expected winnings are equal to the cost to play. Calculate the expected value of the prize and compare it to the £5 cost.
This scenario describes a geometric sequence. Identify the initial term and the common ratio.
First, set up an inequality where the expected value of the prize in week is greater than the cost of the box. Solve for using logarithms to find . Then, calculate the expected value for week and subtract the cost to find the profit.
Question 20
MediumPaper 1 · no calculator15 marksA function is defined by , for .
The following diagram shows part of the graph of .
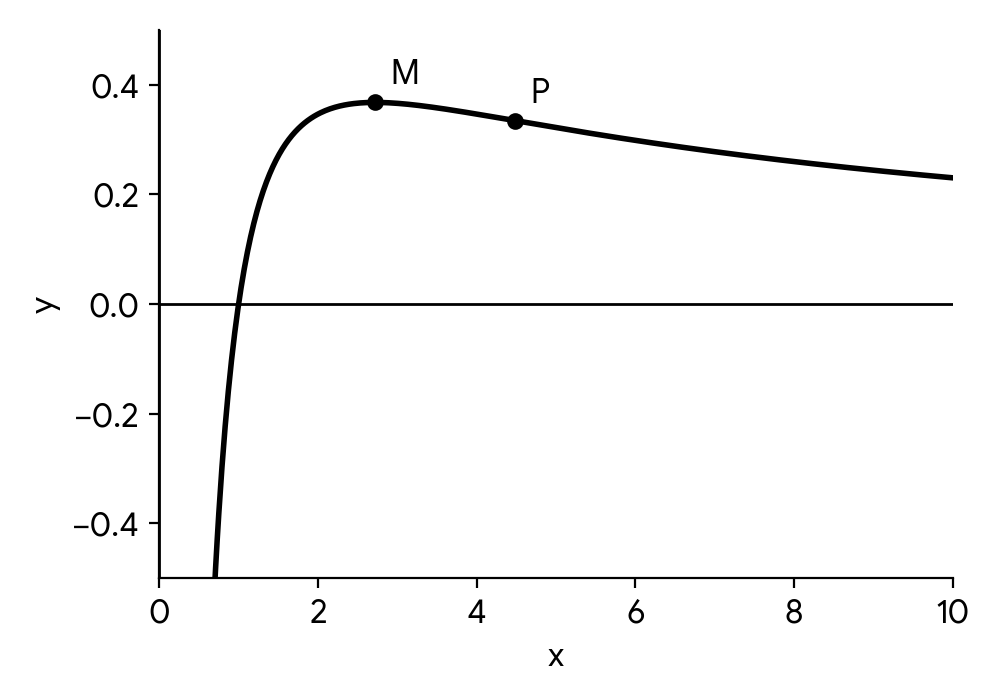
(a) Find the coordinates of the x-intercept of the graph of .
(b) Find .
The graph of has a local maximum at point M.
(c) Hence, find the exact coordinates of M.
(d) (i) Show that .
The graph of has a point of inflection at point P.
(d) (ii) Hence, find the exact coordinates of P.
The x-intercept is the point where the graph crosses the x-axis. At this point, the y-coordinate is zero. Set and solve for .
To differentiate a function that is a fraction of two other functions, you should use the quotient rule: .
A local maximum occurs at a stationary point, where the first derivative is equal to zero. Set your expression for from part (b) to zero and solve for . Then, substitute this -value back into the original function to find the corresponding -coordinate.
You need to find the second derivative, , by differentiating . You will need to use the quotient rule again.
A point of inflection occurs where the second derivative changes sign. This can happen where . Set the expression for to zero and solve for . Then find the corresponding -coordinate.
No question on this page matches those filters. Try another difficulty or paper.
93 more Solving equations [f(x)=0 or f(x)=g(x)] (graphically, analytically, GDC) questions in the app
Every answer is marked mark by mark, IB-style, and the AI tutor helps when you are stuck.
Where marks are lost
- Using your own wrong value after failing a "show that".
