Stats basics (population, 5 sampling techniques, outlier definition): notes and practice questions
- Population: The entire set of data or individuals being studied.
- Sampling Techniques:
1. Random Sampling: Every member has an equal chance of being selected.
2. Systematic Sampling: Every nth member is selected.
3. Stratified Sampling: Divides population into subgroups and samples from each.
4. Cluster Sampling: Population is divided into clusters, and a random sample of clusters is selected.
5. Convenience Sampling: Samples are chosen based on ease of access.
- Outliers: Data points significantly different from others, often identified using the interquartile range (IQR):
How it is examined
The outlier definition is a hard number and a `Show that` question can be built straight from it. The five named sampling techniques are a closed list, so a question asking a student to name and evaluate one is safe to generate, and a question about cluster sampling is not. `Identify`, `State`, `Explain`. 2 to 4 marks.
- Concepts of population, sample, random sample, discrete and continuous data.
- Reliability of data sources and bias in sampling.
- Interpretation of outliers.
- Sampling techniques and their effectiveness.
Linking questions
- Aim 8: misleading statistics, for example the Google flu predictor, the 1936 US presidential election, Literary Digest versus George Gallup.
Practice questions
16 questions · 4 easy · 12 mediumQuestion 1
EasyPaper 1 · no calculator4 marksA biologist is studying a population of birds in a forest. State whether each of the following descriptions of data collected would be discrete or continuous.
(a) The number of eggs in a bird's nest.
(b) The wingspan of a bird, in centimetres.
(c) The time taken for a bird to fly between two specific trees.
(d) The number of birds observed at a feeding station each hour.
Think about whether the data can be counted in whole numbers or if it needs to be measured and can take any value within a range.
Can the wingspan be any value, like 15.3 cm or 15.31 cm, or is it restricted to specific, separate values?
Is time something you count in whole units, or is it measured on a continuous scale?
Are you counting the birds, or are you measuring a characteristic of the birds?
Question 2
MediumPaper 2 · calculator7 marksA group of 39 students were asked how many hours they spent studying for a mathematics test. The results are shown in the frequency table below.
| Hours Studied (h) | Frequency (f) |
|---|---|
| 0 | 2 |
| 1 | 5 |
| 2 | 8 |
| 3 | 12 |
| 4 | 7 |
| 5 | 4 |
| 6 | 1 |
(a) Write down the modal number of hours spent studying.
(b) Calculate the range of the number of hours spent studying.
(c) Find the mean number of hours spent studying.
(d) Find the variance.
The mode is the value that appears most frequently in a data set. Look for the highest frequency in the table.
The range is the difference between the maximum and minimum values in the data set. What is the highest number of hours studied and what is the lowest?
Use the statistical functions of your calculator. Enter the 'Hours Studied' as your list of data (L1) and the 'Frequency' as your list of frequencies (L2).
Variance is the square of the population standard deviation. You can find the population standard deviation (σx) using your calculator and then square it.
Question 3
EasyPaper 1 · no calculator10 marksA large technology company, 'Innovate Inc.', is considering a new flexible work-from-home policy. To gather employee feedback, the management decides to form a focus group of 20 employees.
The company has 1000 employees distributed across five departments: 400 in Engineering, 200 in Marketing, 150 in Sales, 50 in Human Resources, and 200 in Administration.
Describe how you would select a focus group using
(a) random sampling.
(b) stratified sampling.
(c) quota sampling.
(d) convenience sampling.
For random sampling, every employee must have an equal chance of being selected. Think about how you could create a list of all employees and then select 20 from it without any bias.
Stratified sampling involves dividing the population into subgroups (strata) and then taking a proportional sample from each. What are the natural subgroups in this company?
Quota sampling is similar to stratified sampling in setting targets for subgroups, but how does the actual selection of individuals differ? Is it random?
The name 'convenience sampling' says it all. How would you select a sample in the easiest way possible, without considering representation?
Question 4
MediumPaper 1 · no calculator5 marksA group of students were timed in minutes on how long it took them to solve a logic puzzle. The results are summarized in the following box and whisker diagram, where and represent the lower and upper quartiles respectively.
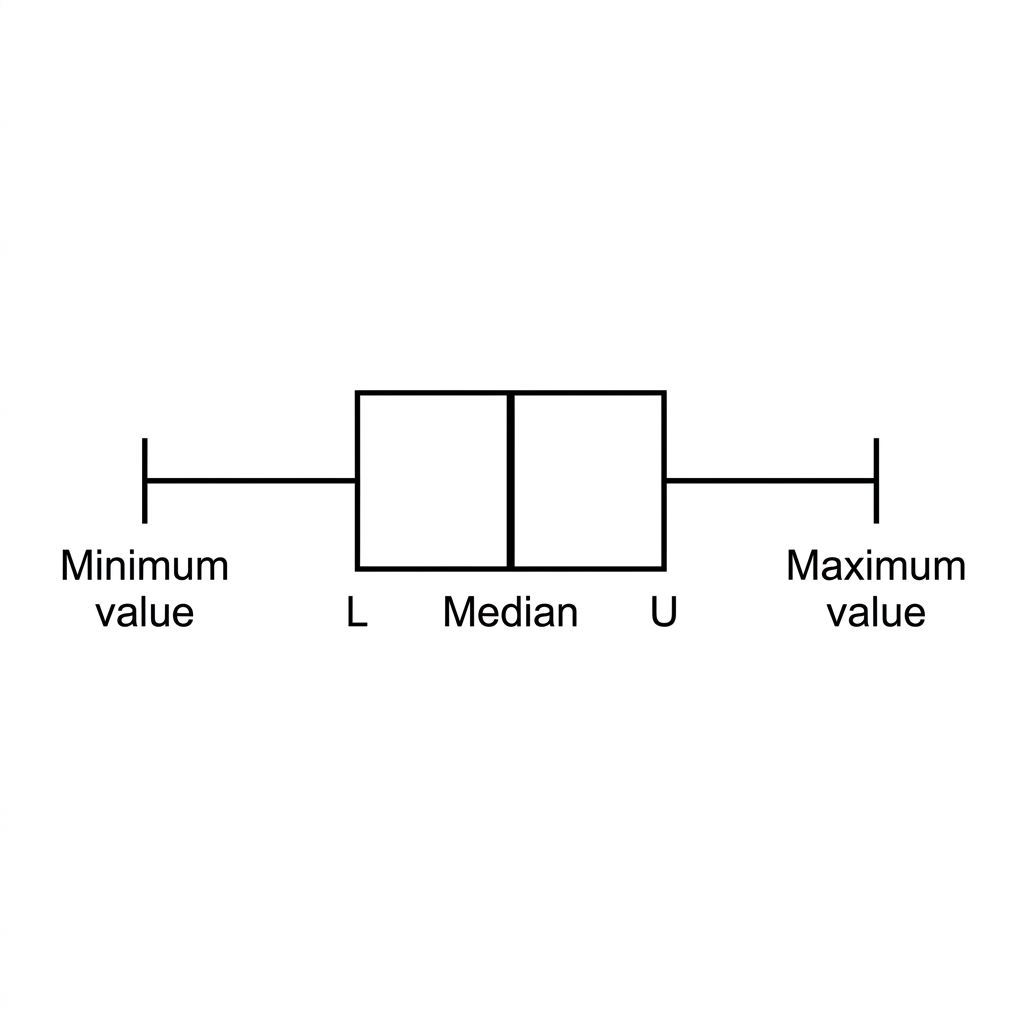
The interquartile range is 8 minutes, and the minimum time recorded was 5 minutes. There are no outliers in the data.
(a) Find the maximum possible value of .
(b) Hence, find the maximum possible value of .
Recall the formula for determining a lower outlier. The minimum value of the data set must not be an outlier. Set up an inequality using this information.
The interquartile range is the difference between the upper and lower quartiles. Use your answer from part (a) to find the corresponding value for U.
Question 5
EasyPaper 1 · no calculator2 marksA professional basketball game is being analyzed. State one feature of the game that can be described by a discrete variable.
State one feature of the game that can be described by a continuous variable.
A discrete variable is one that can only take on specific, countable values. Think about aspects of the game that are counted in whole numbers.
A continuous variable can take any value within a given range. Think about aspects of the game that are measured rather than counted.
Question 6
MediumPaper 1 · no calculator5 marksA sports scientist records the time, in seconds, for a group of athletes to run 400 metres. The results are summarized in the following box and whisker diagram, where and are the lower and upper quartiles respectively.
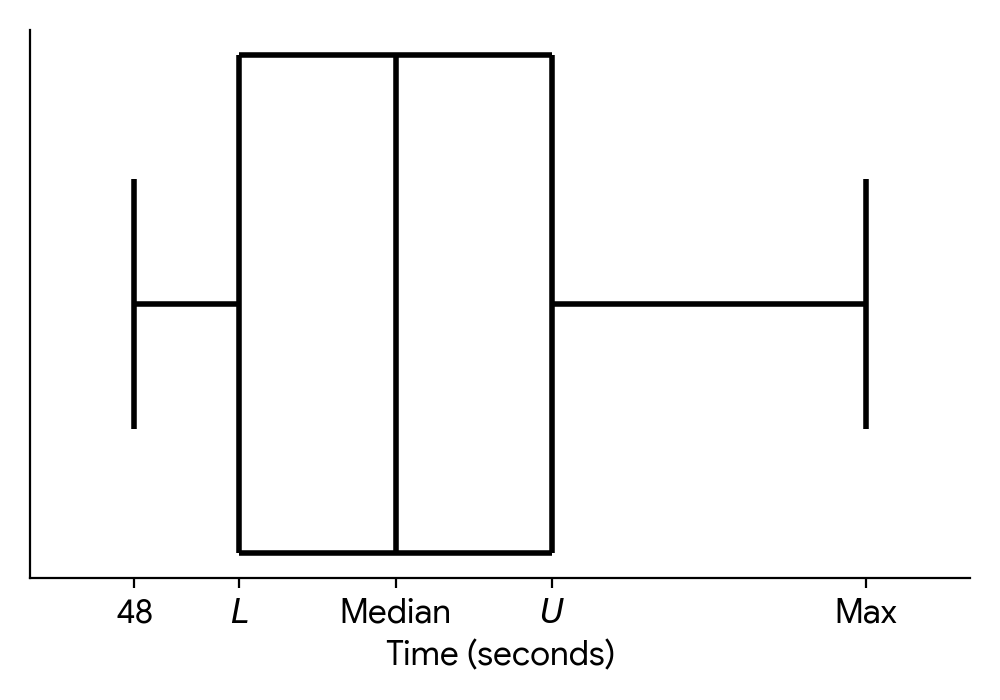
The interquartile range is 6 seconds and there are no outliers in the data.
(a) Find the maximum possible value of .
(b) Hence, find the maximum possible value of .
Recall the formula for determining lower outliers. Since there are no outliers, the minimum recorded time must be greater than or equal to the lower outlier boundary. Use this to set up an inequality involving .
Use the relationship between the interquartile range (IQR), the lower quartile (), and the upper quartile (). You will need your answer from part (a).
Question 7
EasyPaper 1 · no calculator7 marksA biologist is conducting a study on a population of monarch butterflies in a nature reserve. For each butterfly captured, several measurements and observations are recorded.
For each of the variables listed below, determine if it is quantitative or qualitative. If the variable is quantitative, further classify it as discrete or continuous.
(a) The number of spots on the wings.
(b) The wingspan, measured in centimetres.
(c) The primary colour of the butterfly (e.g., orange, yellow, white).
(d) The distance the butterfly has migrated, estimated in kilometres.
Think about the nature of the data for the number of spots. Can it be counted in whole numbers, or can it take any value within a range? Is it a numerical measurement or a descriptive category?
Consider whether the wingspan measurement can take on any value within a certain interval, including fractions or decimals.
Does the colour of the butterfly represent a numerical quantity or a category/description?
Think about whether the distance is restricted to specific values or can vary smoothly over a range.
Question 8
MediumPaper 1 · no calculator15 marksA tech company is testing the battery life of its new smartphone. A sample of 120 phones are tested to see how long their batteries last under continuous video playback. The results are shown in the cumulative frequency graph below.
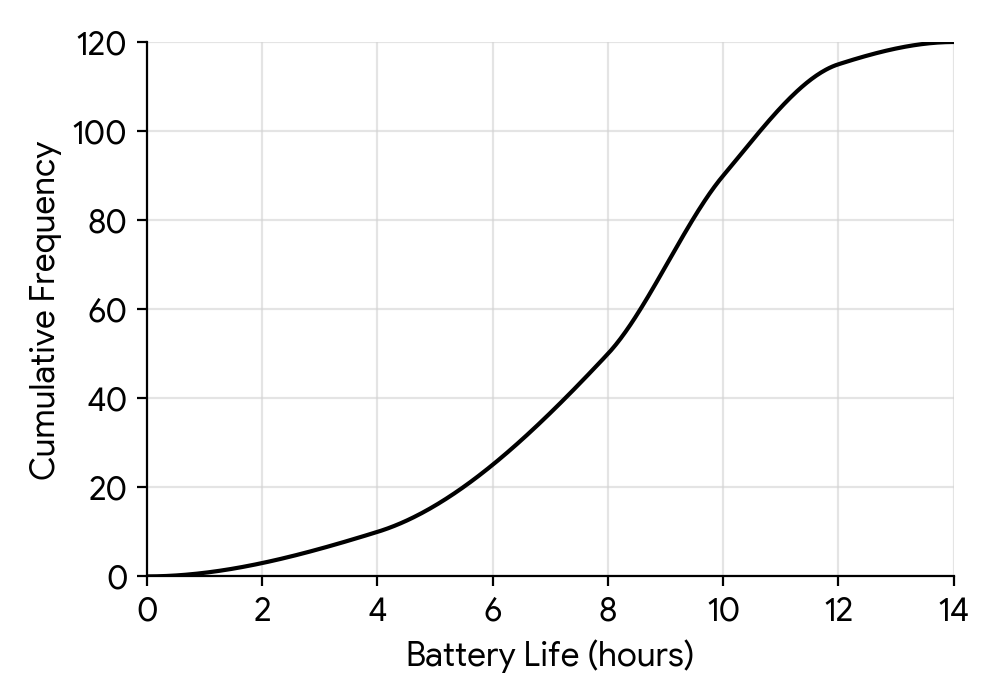
(a) Find the median battery life.
(b) The lowest 25% of battery lives in the sample are less than hours. Find the value of .
(c) The same data is represented by the following frequency table.
| Battery Life (h) | ||||
|---|---|---|---|---|
| Frequency | 10 | 5 |
Find the value of and the value of .
(d) The company manufactures a batch of 10,000 of these smartphones. Estimate the number of phones in the batch that will have a battery life of more than 10 hours.
(e) The company wishes to advertise the 'typical' battery life of the phone based on this test.
(i) Explain why this testing method might not provide an accurate representation of the battery life for a typical user.
(ii) Suggest a more appropriate method for testing the battery life to represent a typical user.
The median is the value for the middle data point. In a cumulative frequency graph with N data points, this corresponds to the value on the x-axis for a cumulative frequency of N/2.
This question is asking for the lower quartile (Q1). First, calculate the cumulative frequency corresponding to the 25th percentile, and then find the corresponding value on the x-axis from the graph.
The cumulative frequency is the running total of the frequencies. To find the frequency for a specific interval, you need to subtract the cumulative frequency at the start of the interval from the cumulative frequency at the end of the interval.
First, use the graph to find the number of phones in the sample with a battery life of more than 10 hours. Then, use this proportion to estimate the number for the entire batch of 10,000 phones.
Think about how you use your own phone. Is it always for continuous video playback? What other activities affect battery life?
How could the company make the test more realistic?
Question 9
MediumPaper 1 · no calculator7 marksA study was conducted to investigate the relationship between the number of hours, , a student spends studying for an exam and their score, (%), in that exam.
The number of hours spent studying is summarized in the following box and whisker diagram.
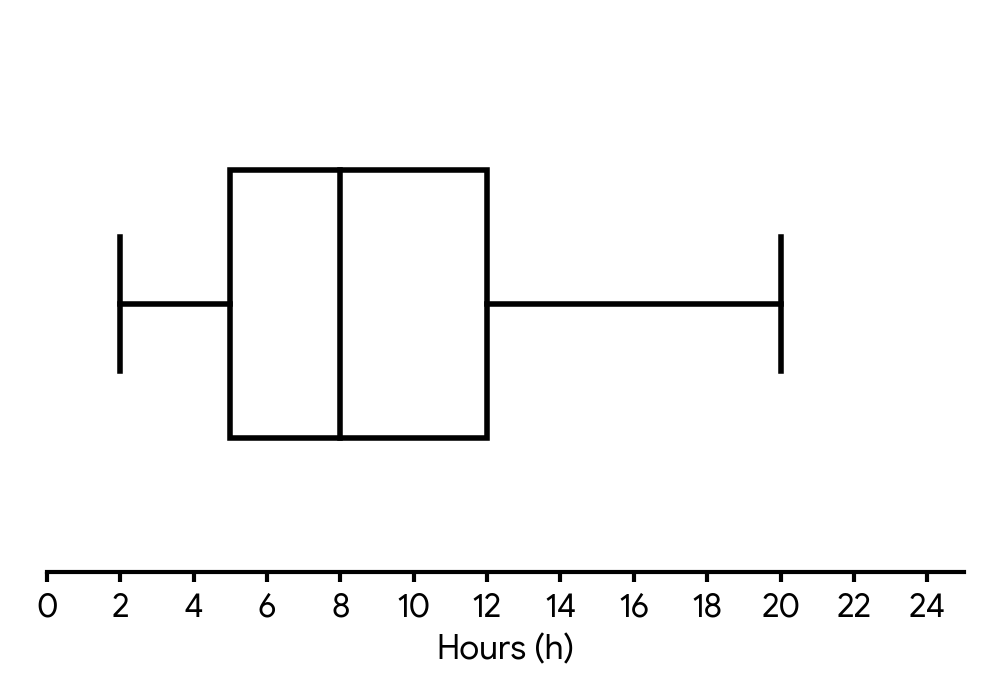
(a) Find the largest value of that would not be considered an outlier.
The regression line of on is . The regression line of on is .
(b) (i) One of the students scored 90% on the exam. Estimate the number of hours they studied.
(ii) Find the mean score of all the students in the study.
Recall the formula for identifying outliers using the interquartile range (IQR). The upper boundary is calculated as .
You are given the exam score () and asked to estimate the hours studied (). You should use the regression line of on .
The point representing the mean hours and mean score lies on both regression lines. You need to find the intersection point of the two lines.
Question 10
MediumPaper 1 · no calculator21 marksA new coffee shop records the number of customers, , per hour during its 120 opening hours in a week. The number of customers per hour is shown in the following frequency table.
| Number of customers () | Frequency (hours) |
|---|---|
| 15 | |
| 28 | |
| 22 | |
| 13 |
(a) Find the value of .
(b) Write down the modal class.
The following cumulative frequency diagram also displays these data.
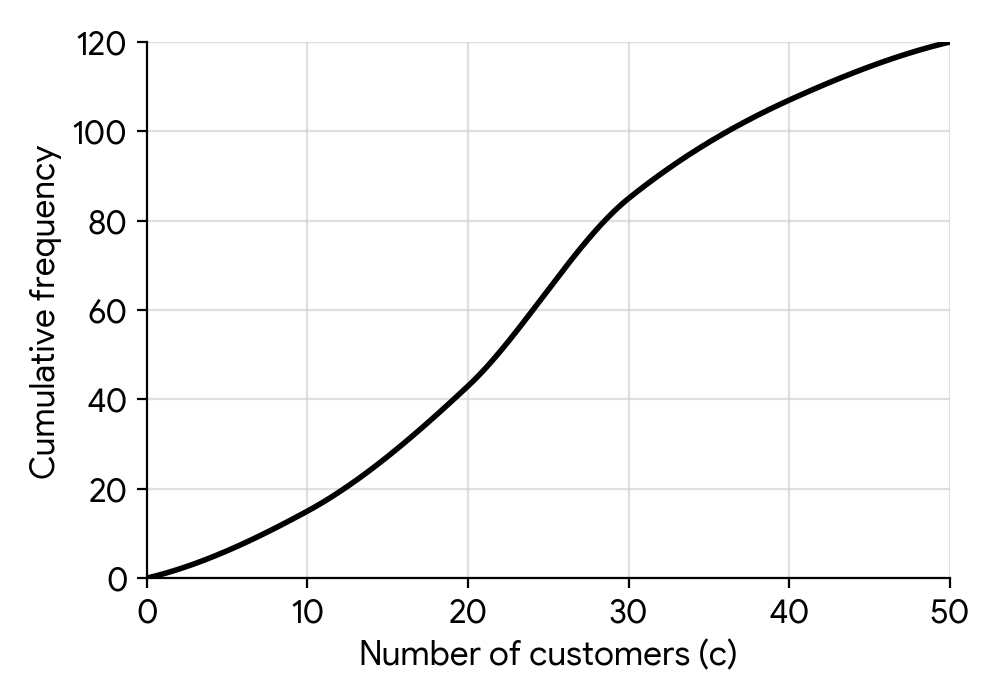
(c) Use the cumulative frequency curve to estimate the median number of customers per hour.
(d) The coffee shop is considered 'busy' when there are more than 35 customers. Use the cumulative frequency curve to estimate the number of hours the coffee shop was busy.
The coffee shop manager wants to survey customers about their experience.
(e) State one disadvantage of surveying only the customers who arrive between 8 am and 9 am on a Monday.
(f) Describe how the manager could use systematic sampling to survey customers throughout a single day.
The total number of customers for the week was 2900. The following box and whisker diagram displays the amount of money, in USD, spent by customers during their visit.
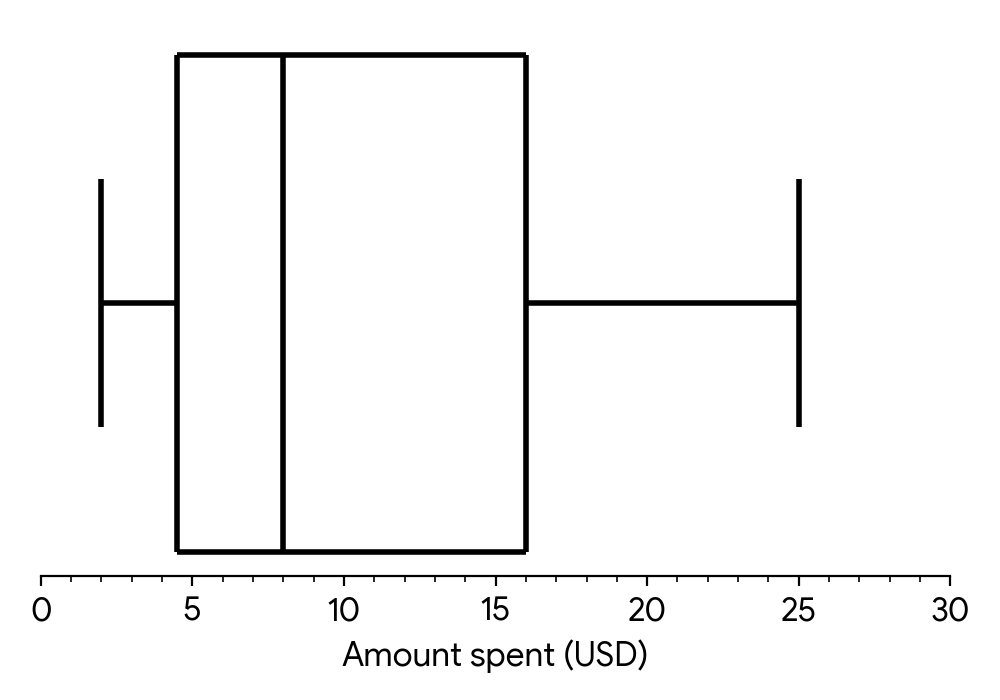
(g) Estimate the number of customers who spent between $4.50 and $16.
(h) The top 25% of customers spent more than USD. Find the value of .
The following week, a new promotion is introduced, which is expected to attract an additional 3 customers per hour.
(i) Calculate the new mean number of customers per hour.
(j) State, with a reason, the effect this increase would have on the range of the number of customers per hour.
The total frequency is given in the question. The sum of the frequencies in the table must equal this total.
The modal class is the class interval with the highest frequency.
The median is the value corresponding to 50% of the total frequency. Find this value on the cumulative frequency axis and read the corresponding value on the horizontal axis.
First, find the cumulative frequency for 35 customers from the graph. This tells you how many hours had 35 or fewer customers. Then, use the total number of hours to find how many hours had more than 35 customers.
Consider whether this group of customers is representative of all customers who visit the coffee shop at different times and on different days.
Systematic sampling involves selecting items at regular intervals from an ordered list. How could you apply this to customers entering a shop?
Identify what $4.50 and $16 represent on the box and whisker diagram. What percentage of the data lies between these two values?
The 'top 25%' corresponds to a specific feature of the box and whisker plot. Which one is it?
First, calculate the original mean number of customers per hour. Then, consider how adding 3 to each hourly count affects this mean.
The range is the difference between the maximum and minimum values. If every data point increases by 3, what happens to the maximum value? What happens to the minimum value? What happens to their difference?
Question 11
MediumPaper 1 · no calculator8 marksState the mathematical condition used to identify outliers in a set of data.
A botanist measures the heights, in cm, of 11 seedlings. The results, ordered from smallest to largest, are shown below.
Find the median, the lower quartile, the upper quartile, and the interquartile range for these heights.
Using the condition from part (a), identify, with a reason, any outliers for this set of data.
The condition involves the interquartile range (IQR). How far away from the quartiles can a data point be before it's considered an outlier?
The data is already ordered. Identify the middle value for the median. Then find the median of the lower and upper halves of the data for the quartiles. The interquartile range is the difference between the upper and lower quartiles.
Use your values for Q1, Q3, and IQR from part (b) to calculate the upper and lower boundaries for outliers. Then check if any data points fall outside these boundaries.
Question 12
MediumPaper 2 · calculator6 marks(a) A small artisanal bakery recorded its daily revenue for days, finding a mean revenue of USD. On the th day, a special promotion was run, and the mean revenue for all days increased to USD. Find the revenue generated on the th day.
(b) For the days, the lower quartile () of the daily revenue was USD and the upper quartile () was USD. Determine, with justification, whether the revenue on the th day (found in part (a) ) is considered an outlier.
Recall that the mean is calculated by dividing the sum of all values by the number of values. You can use this to find the total revenue before and after the th day.
An outlier is typically defined as a value that falls outside the range , where .
Question 13
MediumPaper 2 · calculator19 marks(a) Data on the number of goals scored by a football team in each of their matches during a season is represented in the table below.
| Number of goals () | Frequency () |
|---|---|
State whether this data is discrete or continuous.
(b) Find the mode.
(c) (i) Find the mean.
(c) (ii) Find the standard deviation.
(d) (i) Find the median.
(d) (ii) Find the lower quartile ().
(d) (iii) Find the upper quartile ().
(e) Hence draw a box-and-whisker plot for this data using a scale of cm for goal.
(f) Identify with justification any outliers.
Consider the nature of 'number of goals'. Can it take any value within a range, or only specific, distinct values?
The mode is the value that appears most frequently in the data set.
Use the formula for the mean of a frequency distribution: . You can also use your GDC's statistics function.
Use the formula for standard deviation of a frequency distribution, or use your GDC's statistics function. Remember to use the population standard deviation () for grouped data unless otherwise specified.
For data points, the median is the value at the position. For discrete data, if this position is , it's the average of the -th and -th values. Alternatively, use your GDC.
For data points, the lower quartile () is the value at the position. For discrete data, if this position is or , round up to the next integer position. Alternatively, use your GDC.
For data points, the upper quartile () is the value at the position. For discrete data, if this position is or , round up to the next integer position. Alternatively, use your GDC.
You need the five-number summary: minimum, , median, , maximum. Plot these points on a scaled axis and draw the box and whiskers accordingly. Remember the scale: cm for goal.
An outlier is typically defined as a data point that falls below or above . Calculate the Interquartile Range (IQR) first.
Question 14
MediumPaper 1 · no calculator5 marksA technology company has 800 employees spread across four departments. The number of employees in each department is as follows:
- Engineering: 300
- Sales: 240
- Marketing: 150
- Human Resources (HR): 110
The company wants to conduct a survey on employee satisfaction using a stratified sample of 80 employees, with the departments as the strata.
(a) Calculate the number of employees that should be selected from each department.
(b) Describe how the employees from the Sales department could be selected for the sample.
For each department, calculate its proportion of the total workforce (e.g., Engineering is 300 out of 800 employees). Then, multiply this proportion by the total desired sample size (80) to find the number of employees to select from that department.
Your description should outline a fair and random process. Think about how you can give every employee in the Sales department an equal chance of being chosen. What tools or methods could ensure this randomness?
Question 15
MediumPaper 1 · no calculator6 marksChloe has taken 8 tests in her mathematics class and her mean score is 85%. After taking a ninth test, her new mean score for all 9 tests is 87%. Find Chloe's score on the ninth test.
For the 9 test scores, the lower quartile is 82% and the upper quartile is 90%. Determine whether Chloe's score on the ninth test is an outlier, justifying your answer.
The mean score is the sum of all scores divided by the number of tests. Calculate the total score for the first 8 tests and then the total score for all 9 tests.
An outlier is a data point that lies outside the range defined by and . First, calculate the interquartile range (IQR).
Question 16
MediumPaper 1 · no calculator5 marksA market research company is conducting a survey to determine the popularity of a new brand of energy drink, "VoltX", among young adults aged 18-25. The company decides to conduct the survey by interviewing people at a local university campus on a weekday afternoon.
(a) (i) State the name of this sampling method.
(ii) Give one reason why this sampling method might not provide a representative sample of the target population.
(b) One of the questions in the survey is: "Don't you think that the refreshing and energizing taste of VoltX is superior to other bland energy drinks on the market?"
State two criticisms of this question.
Consider how the individuals are being selected for the survey. Is it random or based on what is easiest for the surveyor?
Think about the characteristics of the people on a university campus. Does this group include all young adults aged 18-25 in the area? What about those who work or are not in higher education?
Analyze the language used in the question. Is it neutral? Does it lead the respondent to a specific answer? Does it make assumptions?
No question on this page matches those filters. Try another difficulty or paper.
Every Stats basics (population, 5 sampling techniques, outlier definition) question, marked for you
Every answer is marked mark by mark, IB-style, and the AI tutor helps when you are stuck.
Where marks are lost
- Rounding an intermediate value and then using it.
- Answering to the wrong accuracy. Two significant figures, or six, where the rule says exactly or three.
- Writing the answer and nothing else.
