Random variables + effects linear transformations (mean, variance): notes and practice questions
- Random variables can be discrete (countable) or continuous (measurable).
- For discrete variables, use Probability Mass Functions (PMF) to define probabilities, and calculate mean and variance using summations.
- For continuous variables, use Probability Density Functions (PDF) where probabilities are areas under the curve, and calculate mean and variance using integrals.
- Linear transformations affect the mean by and the variance by .
- Standard deviation is affected by the absolute value of : .
- Key distributions like Binomial and Normal have specific formulas for mean and variance.
How it is examined
The only place in AA statistics where calculus is required, so it pulls in topic 5 and can be set on Paper 1. Standard chain: use to find a constant, then mode by differentiating, then median by solving an integral equation. The in is the classic slip. 7 to 10 marks across parts.
and the integral forms of and for a continuous variable are given.
- Variance of a discrete random variable.
- Continuous random variables and their probability density functions.
- Mode and median of continuous random variables.
- Mean, variance and standard deviation of both discrete and continuous random variables.
Linking questions
- Other contexts: the Poisson distribution may be appropriate for the exploration, but it is not on the AA syllabus and must not appear in a question.
Practice questions
21 questions · 1 easy · 15 medium · 5 hardQuestion 1
EasyPaper 1 · no calculator3 marksThe mean monthly salary of the employees at a company is 450. In December, every employee receives a Christmas bonus of $200. Find the new mean and standard deviation of the employees' income for December.
Consider how adding a constant value to every data point in a set affects the measure of central tendency (the mean) and the measure of spread (the standard deviation).
Question 2
MediumPaper 1 · no calculator8 marksThe continuous random variable has probability density function
(a) Find the value of .
(b) Find .
The total probability for any probability density function must be 1. This means the integral of the function over its domain must equal 1. You'll need to recognize the integral form for arctan.
The expected value is found by calculating the integral of over the domain of the function. You will need to use the value of k you found in part (a).
Question 3
HardPaper 2 · calculator19 marksA new automated manufacturing process produces components. The time, in minutes, taken for a critical assembly step is modelled by a continuous random variable , with a probability density function defined by
Find the exact value of .
Find .
The assembly step is considered "efficient" if it takes less than 1.5 minutes. Each assembly step is independent. Determine the least number of assembly steps required to be 99% sure of at least one efficient step.
Ten assembly steps were conducted.
Find the probability that exactly three steps were efficient.
Write down the number of ways these three efficient steps could have occurred consecutively in a batch of 10.
Now consider a batch of assembly steps where it is given that exactly three efficient steps have occurred.
Write down an expression for the number of ways these three efficient steps could have occurred consecutively.
Find the greatest value of such that the probability of three consecutive efficient steps is more than 0.05, given that exactly three efficient steps have occurred in the batch.
Recall that the expected value for a continuous random variable is given by the integral of over its domain. Consider using a substitution method for integration.
Integrate the probability density function from the lower limit to 1.5. Recall the integral of .
Let be the probability of an efficient step from part (b). The probability of at least one efficient step in trials is . Set up an inequality and solve for .
This is a binomial probability problem. Identify , , and , then use the binomial probability formula .
Consider placing a block of 3 consecutive successes within the 10 trials. If the block starts at position 1, 2, etc., how many starting positions are there?
Generalize your approach from part (e) for trials instead of 10.
This is a conditional probability problem. The probability is the ratio of (number of ways for 3 consecutive successes) to (total number of ways for exactly 3 successes in trials). Set up an inequality and solve for .
Question 4
MediumPaper 1 · no calculator5 marksA continuous random variable has probability density function defined by
where is a positive real number.
(a) State in terms of .
(b) Use integration to find in terms of .
For a uniform distribution over an interval , the expected value (or mean) is the midpoint of the interval. What is the midpoint of ?
Recall the formula for variance: . You will need to calculate using the integral definition: .
Question 5
HardPaper 1 · no calculator14 marksA marine biologist is studying a species of sea turtle. She collects data on the carapace length, cm, and mass, kg, for 30 turtles. The Pearson's product-moment correlation coefficient for this data is found to be . The equation of the regression line of on is .
The biologist discovers her measuring tape was misaligned, and all length measurements are 2 cm too short. Her weighing scale was also faulty, showing a mass 1.5 kg less than the true mass for each turtle. The data is corrected for these errors.
(i) State the new value of the Pearson's product-moment correlation coefficient, .
(ii) State the new value for the gradient of the regression line of on .
(iii) Briefly justify your answers to part (a)(i) and (a)(ii).
The biologist decides to present her findings to an international conference and converts her original measurements to different units. She converts the original length measurements from cm to mm, and the original mass measurements from kg to g.
(i) State the new value of .
(ii) Find the new value for the gradient of the regression line of mass on length.
(iii) Briefly justify your answer for the new gradient.
For a different analysis, the biologist defines a "size index", , as . She investigates the relationship between the size index and the original mass in kg.
(i) Find the value of for the correlation between and .
(ii) Find the gradient of the regression line of on .
(iii) Describe the linear correlation between the size index and the mass .
The data is being corrected by adding a constant value to all length measurements and another constant value to all mass measurements. How does such a transformation (a translation) affect the correlation coefficient?
The gradient of the regression line is given by . How does adding a constant to all data points affect the standard deviations and ?
Consider the definitions of correlation and standard deviation. A translation shifts the entire data cloud without changing its shape, spread, or orientation.
The conversion from cm to mm and kg to g involves multiplying the data by positive constants. How does scaling by a positive constant affect the correlation coefficient?
The new measurements are and . The gradient is affected by the scaling of both variables. Use the formula .
Explain how the scaling of each variable affects their respective standard deviations and, consequently, the gradient of the regression line using the formula .
The new variable is . This is a linear transformation of . How does multiplying a variable by a negative number affect the correlation coefficient?
The gradient is . You have the new from part (c)(i). How does the transformation affect the standard deviation of the x-variable?
The description should include both the strength and the direction of the correlation, based on the value of you found in (c)(i).
Question 6
MediumPaper 1 · no calculator7 marksA biologist records the number of eggs in the nests of a certain species of bird. The results for 25 nests are shown in the following frequency table.
| Number of eggs (x) | 1 | 2 | 3 | 4 | 5 |
|---|---|---|---|---|---|
| Frequency (f) | p | 6 | q | 4 | 2 |
It is given that the mean number of eggs per nest is 2.6.
(a) Find the value of p and the value of q.
The biologist enters the data into a competition. The competition score is calculated using the formula , where is the number of eggs in a nest.
(b) Find the mean competition score.
You are given two key pieces of information: the total number of nests and the mean number of eggs. Use these to set up two separate equations involving p and q. Then, solve these equations simultaneously.
Recall the effect of a linear transformation on the mean of a dataset. If each data point is transformed to , how does the mean change?
Question 7
HardPaper 1 · no calculator12 marksA continuous random variable has probability density function
Show that .
Find the variance of .
The total probability for any probability density function must be equal to 1. Set up the definite integral of over its domain and set it equal to 1. You will need to use integration by parts to solve the integral.
Recall that the variance is given by . You will need to calculate the expected value and the expected value of the square, , by setting up and solving the appropriate definite integrals, again using integration by parts.
Question 8
MediumPaper 1 · no calculator21 marksA new coffee shop records the number of customers, , per hour during its 120 opening hours in a week. The number of customers per hour is shown in the following frequency table.
| Number of customers () | Frequency (hours) |
|---|---|
| 15 | |
| 28 | |
| 22 | |
| 13 |
(a) Find the value of .
(b) Write down the modal class.
The following cumulative frequency diagram also displays these data.
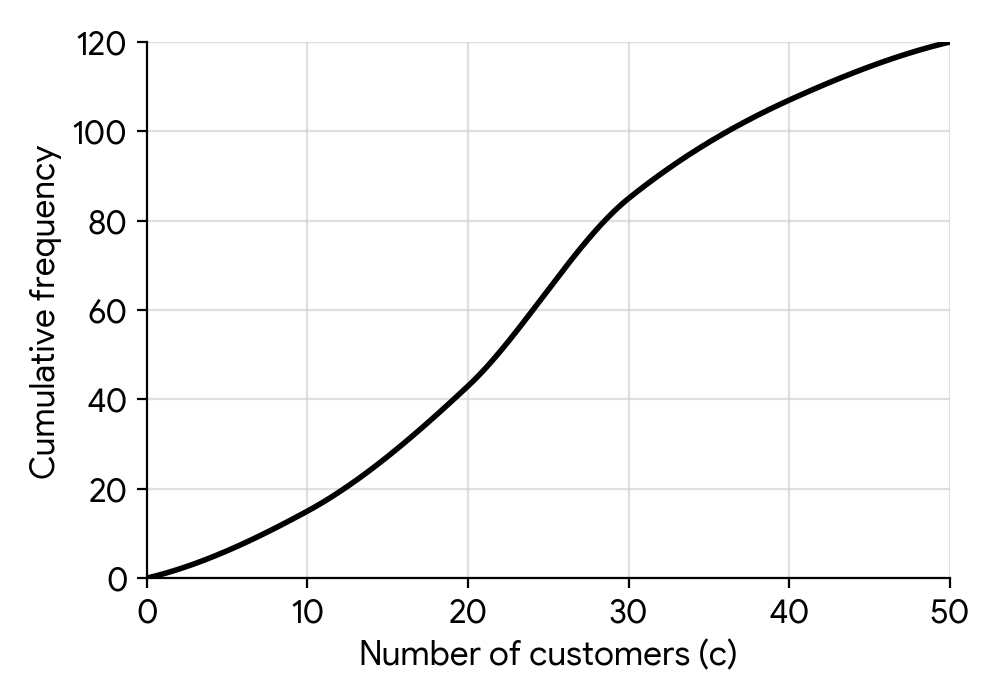
(c) Use the cumulative frequency curve to estimate the median number of customers per hour.
(d) The coffee shop is considered 'busy' when there are more than 35 customers. Use the cumulative frequency curve to estimate the number of hours the coffee shop was busy.
The coffee shop manager wants to survey customers about their experience.
(e) State one disadvantage of surveying only the customers who arrive between 8 am and 9 am on a Monday.
(f) Describe how the manager could use systematic sampling to survey customers throughout a single day.
The total number of customers for the week was 2900. The following box and whisker diagram displays the amount of money, in USD, spent by customers during their visit.
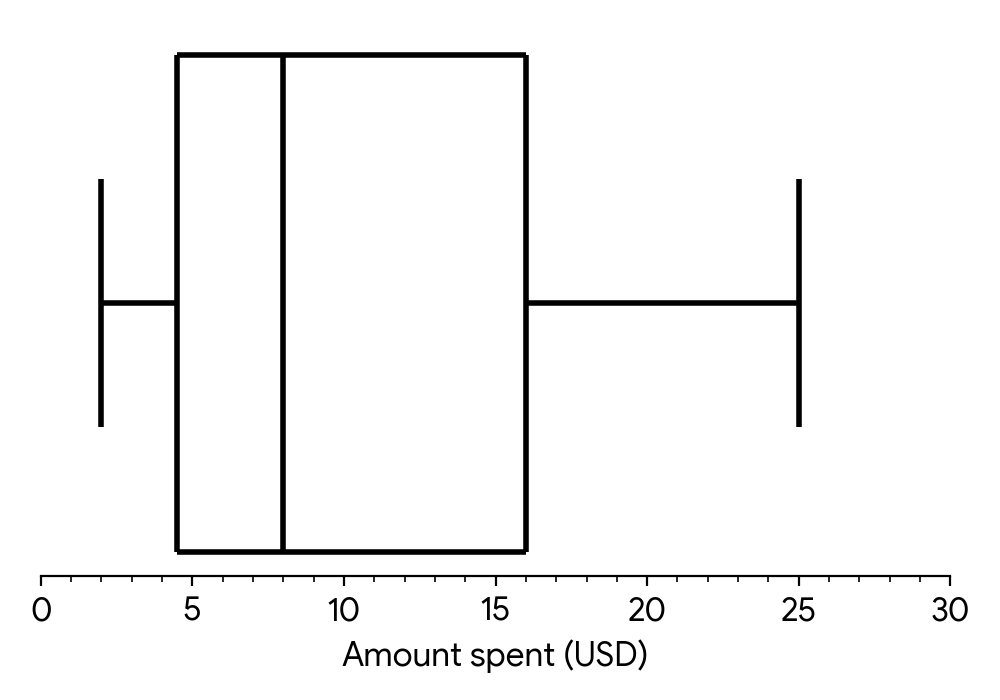
(g) Estimate the number of customers who spent between $4.50 and $16.
(h) The top 25% of customers spent more than USD. Find the value of .
The following week, a new promotion is introduced, which is expected to attract an additional 3 customers per hour.
(i) Calculate the new mean number of customers per hour.
(j) State, with a reason, the effect this increase would have on the range of the number of customers per hour.
The total frequency is given in the question. The sum of the frequencies in the table must equal this total.
The modal class is the class interval with the highest frequency.
The median is the value corresponding to 50% of the total frequency. Find this value on the cumulative frequency axis and read the corresponding value on the horizontal axis.
First, find the cumulative frequency for 35 customers from the graph. This tells you how many hours had 35 or fewer customers. Then, use the total number of hours to find how many hours had more than 35 customers.
Consider whether this group of customers is representative of all customers who visit the coffee shop at different times and on different days.
Systematic sampling involves selecting items at regular intervals from an ordered list. How could you apply this to customers entering a shop?
Identify what $4.50 and $16 represent on the box and whisker diagram. What percentage of the data lies between these two values?
The 'top 25%' corresponds to a specific feature of the box and whisker plot. Which one is it?
First, calculate the original mean number of customers per hour. Then, consider how adding 3 to each hourly count affects this mean.
The range is the difference between the maximum and minimum values. If every data point increases by 3, what happens to the maximum value? What happens to the minimum value? What happens to their difference?
Question 9
HardPaper 3 · calculator25 marksThis question asks you to investigate the motion of a buoy bobbing up and down in the water.
A buoy bobs up and down in the water.
A fixed origin is the equilibrium position of the buoy (the water level).
The buoy's displacement, metres, from at time seconds is given by
Determine
the amplitude of the buoy's motion;
the buoy's initial displacement from ;
the value of when the buoy first passes through .
Now consider the general case of a buoy bobbing up and down.
The buoy's acceleration is always directed towards a fixed origin at its equilibrium position.
The buoy's acceleration, , at a displacement, , from satisfies the differential equation
The buoy's displacement, , from at time is given by
By finding expressions for and , verify that satisfies the differential equation .
Use the chain rule to show that , where is velocity.
By solving the differential equation, , show that .
Hence, or otherwise, find the buoy's maximum speed.
The continuous random variable denotes the buoy's displacement, , from at time .
The probability density function of is defined by
Show that .
For , the function can be expressed in the form , where and is the buoy's velocity at a displacement, , from .
Find the value of .
Determine , justifying your answer.
Interpret the result found in part (f)(i) in the context of the buoy's motion.
The amplitude is the maximum displacement from the equilibrium position, which corresponds to the coefficient of the sine function.
Initial displacement occurs when time . Substitute this into the displacement equation.
Passing through means the displacement . Solve the equation for the smallest positive value of .
Differentiate the displacement function with respect to twice to find the acceleration, then show it equals .
Start with the definition of acceleration and apply the chain rule by introducing .
Separate the variables and , then integrate both sides. Use the initial conditions or the properties of the motion (like when ) to find the constant of integration.
Consider the expression for . What value of will make as large as possible?
Set up a definite integral of the probability density function between the given limits. Use the standard integral result for .
Use the expression for found in part (c)(ii) to write in terms of , then substitute this into the given form for .
Consider the symmetry of the probability density function or the properties of the integral of an odd function.
What does the expected value of the displacement represent physically for the oscillating buoy?
Question 10
MediumPaper 1 · no calculator8 marksA spinner has four sectors. When the spinner is spun, the score, Y, is a discrete random variable. The probability distribution of Y is given in the following table:
| y | -1 | 0 | 1 | 2 |
|---|---|---|---|---|
| P(Y=y) | k | 2k | 0.5-k | 0.5-2k |
(a) Find the range of possible values of k.
(b) In the case where , determine .
Remember that any probability P(Y=y) must be greater than or equal to zero. Set up inequalities for each probability expression involving k and solve for k.
First, calculate the probabilities for each value of Y when k=0.1. Then, find the expected value E(Y) and the expected value of the square, E(Y^2). Use these to find Var(Y). Finally, recall the property for the variance of a linear transformation: Var(aY+b) = a^2 Var(Y).
Question 11
HardPaper 1 · no calculator8 marksThe continuous random variable has the following probability density function:
(a) Determine the value of .
Find the expected value
To find , use the fact that the total area under the probability density function must equal 1. Integrate from 0 to 1 and set it equal to 1.
The expected value is given by . Use the value of found in part (a).
Question 12
MediumPaper 2 · calculator6 marksA manufacturing process produces components whose defect rate, , is a continuous random variable. The probability density function for the defect rate is modelled by
where is a parameter reflecting the stringency of the quality control.
(a) Show that the expected defect rate, , is given by .
(b) Show that the variance of the defect rate, , is given by .
Recall that for a continuous random variable X with probability density function , the expected value is given by .
Remember that . You will need to calculate first.
Question 13
MediumPaper 2 · calculator5 marksA quality control manager inspects a batch of 40 components for defects. The number of defective components, , follows a binomial distribution, . The variance of the number of defective components is known to be 8.4.
(a) Find the possible values of .
The cost of repairing the batch of components, , is given by the formula (in dollars).
(b) Find Var().
Recall the formula for the variance of a binomial distribution: Var() = . You will need to solve a quadratic equation for .
Remember the property for the variance of a linear transformation: Var() = Var().
Question 14
MediumPaper 1 · no calculator5 marksA set of daily temperature readings for a city, recorded in degrees Celsius (), has a mean of and a standard deviation of . These temperatures are converted to degrees Fahrenheit () using the formula .
(a) Find the mean of the temperatures in degrees Fahrenheit.
(b) Find the standard deviation and the variance of the temperatures in degrees Fahrenheit.
Recall how adding a constant and multiplying by a constant affects the mean of a data set. Apply the entire conversion formula to the original mean.
Remember that adding a constant to every data point does not change the spread (standard deviation or variance). However, multiplying by a constant does. How does it affect the standard deviation? And how is variance related to standard deviation?
Question 15
MediumPaper 2 · calculator8 marksA research team is studying the relationship between the average daily temperature ( in ) during a growing season and the average height of a specific plant species ( in cm) at harvest. They collected data over seven growing seasons.
| Average Daily Temperature ( in ) | Plant Height ( in cm) |
|---|---|
(a) Write down the equation of the on regression line for this data, giving your coefficients to three significant figures.
(b) Estimate the average plant height if the average daily temperature during the growing season was .
Give your answer to one decimal place.
(c) The average daily temperatures were converted from Celsius to Fahrenheit using the formula .
For each of the following quantities, state whether it would change or remain the same:
(i) the mean of the average daily temperatures
(ii) the standard deviation of the average daily temperatures
(iii) the correlation coefficient,
Use your GDC to find the equation of the least squares regression line in the form . Make sure to round the coefficients to three significant figures.
Substitute the given temperature into your regression equation from part (a) and calculate the corresponding plant height. Remember to round to one decimal place.
Consider how adding a constant and multiplying by a constant affect the mean of a dataset.
Consider how adding a constant and multiplying by a constant affect the spread (standard deviation) of a dataset.
Think about whether a linear transformation affects the strength and direction of the linear relationship between two variables.
Question 16
MediumPaper 2 · calculator8 marksA new model of industrial machine has an operating lifetime (in years) which is modelled by a continuous random variable with the following probability density function:
(a) Calculate the expected operating lifetime of the machine, .
(b) The manufacturer offers an extended warranty for years. If the expected value of is , determine the value of .
(c) Find the median operating lifetime of the machine.
Recall that for a continuous random variable with probability density function , the expected value is given by . Remember to split the integral according to the piecewise definition of .
Use the property of expectation that . You have already calculated in part (a).
The median is the value such that . This means . First, check which interval the median falls into by calculating the integral of the first part of the PDF.
Question 17
MediumPaper 1 · no calculator6 marksA farmer has plots of land. The total yield of wheat from all plots is 7200 kg and the mean yield per plot is 120 kg.
(a) Find the number of plots, .
The standard deviation of the yield per plot is 15 kg. The farmer decides to report the yield in a different unit, where all yield values are multiplied by 2.
(b) (i) Write down the value of the new mean yield.
(ii) Find the value of the new variance.
Recall the formula for the mean of a data set: . You are given the mean and the sum.
If every data point in a set is multiplied by a constant 'k', how does the mean of the set change?
Remember the relationship between variance and standard deviation. Also, consider how multiplying every data point by a constant 'k' affects the standard deviation and the variance.
Question 18
MediumPaper 2 · calculator5 marksA spinner used in a children's board game can land on one of six sectors, with scores 0, 1, 2, 3, 4, and 5. Let S be the discrete random variable representing the score from a single spin. The probability distribution of S is given in the table below.
| 0 | 1 | 2 | 3 | 4 | 5 | |
|---|---|---|---|---|---|---|
| 0.10 | 0.20 | 0.30 | 0.20 | 0.15 | 0.05 |
(a) Calculate the value of .
(b) Find .
Recall the formula for the expected value of a function of a discrete random variable, . In this question, the random variable is S and the function is .
There are two common ways to find the variance. You can use the formula , where you'll need to calculate first. Alternatively, you can use your GDC's statistical functions to find the standard deviation and then square it.
Question 19
MediumPaper 2 · calculator7 marksA continuous random variable models the time, in hours, a student spends on a specific online learning module. The probability density function is given by
(a) Determine the median time, , spent on the module.
(b) Given that , determine the value of .
The median of a continuous distribution is the value such that the probability of the random variable being less than or equal to is 0.5.
The expression can be rewritten as .
Question 20
MediumPaper 1 · no calculator4 marksA spinner is divided into eight equally sized sectors. The sectors are numbered 1, 2, 2, 3, 3, 3, 4, 4. Let be the discrete random variable representing the number obtained when the spinner is spun once.
(a) Complete the probability distribution table for .
| (X) | 1 | 2 | 3 | 4 |
|---|---|---|---|---|
| (P(X=x)) |
(b) Find the expected value of .
Determine the total number of possible outcomes and the frequency of each distinct number on the spinner to find the probabilities.
Recall the formula for the expected value of a discrete random variable: .
No question on this page matches those filters. Try another difficulty or paper.
1 more Random variables + effects linear transformations (mean, variance) question in the app
Every answer is marked mark by mark, IB-style, and the AI tutor helps when you are stuck.
Where marks are lost
- Using your own wrong value after failing a "show that".
