Transformations of graphs (translation, reflections, stretches): notes and practice questions
- Translation: Shifts the graph vertically () or horizontally ().
- Reflections: Across the x-axis () or y-axis ().
- Stretches:
- Vertical stretch/compression: .
- Horizontal stretch/compression: (compression if , stretch if ).
How it is examined
Describing a transformation in words is marked strictly: "a translation by the vector " or "a translation of 2 units in the positive -direction", not "moved right". Order matters when a stretch and a translation are combined, and that is the standard trap. `Describe`, `State`, `Sketch`. 3 to 6 marks.
- Transformations of graphs.
- Translations: ; .
- Reflections (in both axes): ; .
- Vertical stretch with scale factor : .
Not required at SL: transformations of the form .
arrives at AHL 2.16.
Linking questions
- Links to other subjects: shift in supply and demand curves (economics); induced emf and simple harmonic motion (physics).
Practice questions
26 questions · 2 easy · 20 medium · 4 hardQuestion 1
EasyPaper 1 · no calculator3 marksThe function is transformed to the function by a horizontal stretch with a scale factor of 2, followed by a translation by the vector . Find the equation of the function .
Recall the rules for function transformations. A horizontal stretch by a factor of transforms to . A translation by a vector transforms to .
Question 2
MediumPaper 1 · no calculator7 marksConsider the functions and , where and .
The graph of is obtained by two transformations of the graph of .
Describe these two transformations.
The -intercept of the graph of is at .
Given that the maximum value of is less than or equal to 1, find the largest possible value of .
Look at how the input to the cosine function has changed, and how the entire function has been shifted vertically.
First, determine the maximum value of in terms of . Use the given condition to find the minimum possible value for . Then, calculate the y-intercept, , and use your result for to find the largest possible value of .
Question 3
HardPaper 1 · no calculator16 marksThe following diagram shows the graph of for , with asymptotes at and .
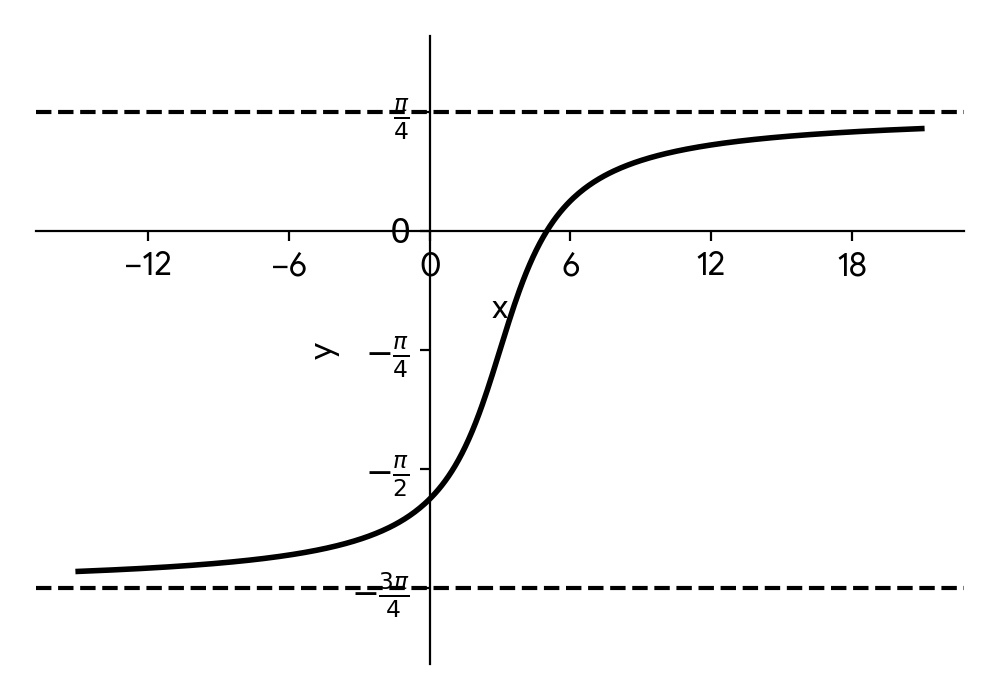
Describe a sequence of transformations that transforms the graph of to the graph of for .
Show that where and .
Using mathematical induction and the result from part (b), prove that
for .
Consider the transformations in the form . Think about the order of transformations, especially for the horizontal stretch and shift.
Let and . Express and in terms of and . Then use the compound angle formula for .
For the inductive step, assume the formula is true for . Then consider the sum for , which is the sum for plus the -th term. Use the identity from part (b) to combine the terms.
Question 4
EasyPaper 1 · no calculator5 marksConsider the function and the function which is obtained through horizontally translating 1 unit to the right also vertically translating it by 2 units downwards.
Find .
The function has a minimum at . Find .
Moving to the right means substituting x by (x-a) and moving downwards mean subtracting by a constant at the end of the function.
There is a minimum or a maximum point when the derivative of a function is equal to zero.
Question 5
MediumPaper 1 · no calculator8 marksThe following diagram shows the graph of , where , for , and .
The graph has a y-intercept at and an x-intercept at .
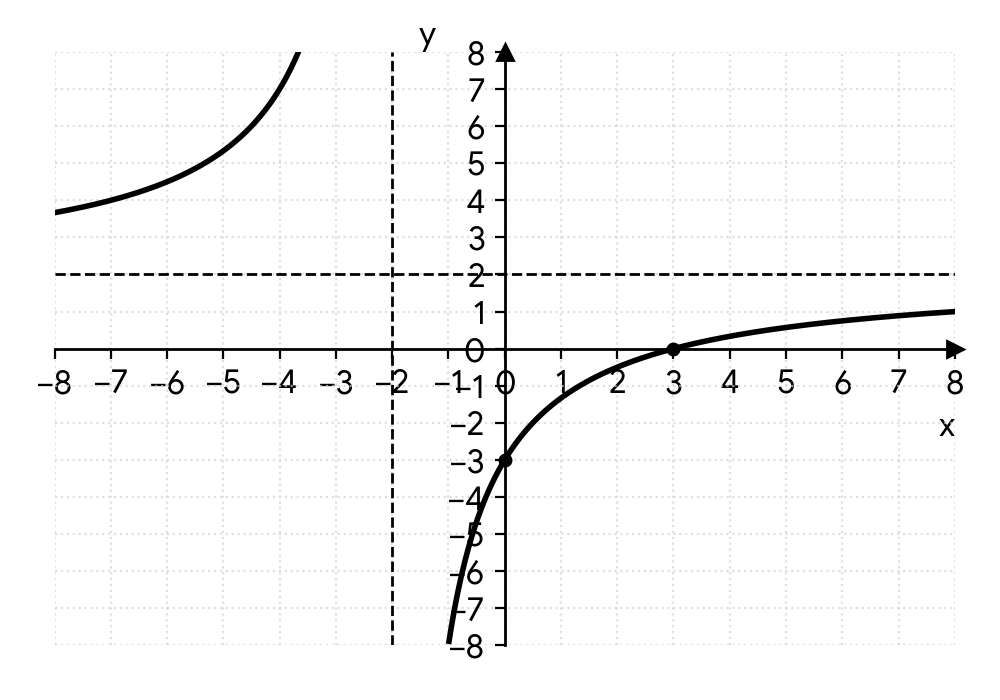
(a) Find the value of and the value of .
(b) Describe a sequence of transformations that maps the graph of onto the graph of .
Substitute the coordinates of the x-intercept and y-intercept into the function's equation to create a system of two linear equations with two variables, C and D.
First, rewrite the function in the form using algebraic long division or by manipulating the numerator. Then, identify the transformations (translation, stretch, reflection) and their parameters based on the values of P, Q, and R.
Question 6
HardPaper 1 · no calculator7 marksConsider the functions and , where and .
The graph of is obtained by two transformations of the graph of .
(a) Describe these two transformations.
The -intercept of the graph of is at .
(b) Given that the maximum value of is 1, find the value of .
Look at the changes inside the cosine function for the horizontal transformation and the changes outside the function for the vertical transformation. Remember the sign conventions for translations.
First, find the maximum value of the function in terms of . Use the given information that this maximum value is 1 to find the value of . Then, calculate the -intercept, , by evaluating .
Question 7
MediumPaper 2 · calculator14 marksThe daily temperature, in degrees Celsius, in a coastal city is modelled by the function , where is the number of hours after midnight, and and are constants, where , and .
The following graph shows the temperature for a 24-hour period, starting at midnight.
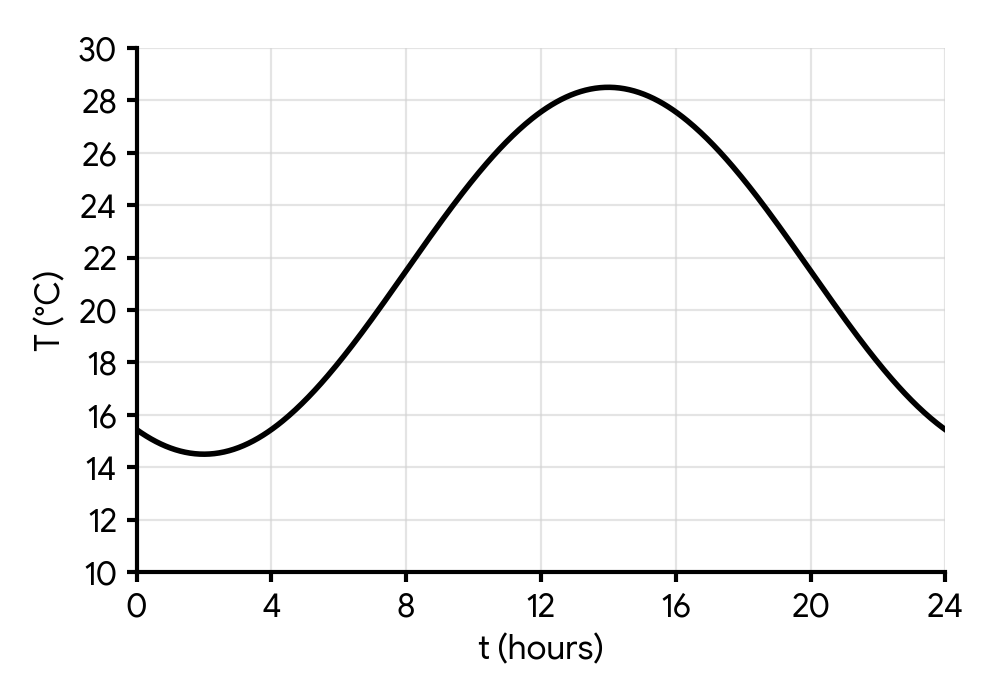
The first peak temperature occurs at 14:00 (2 PM) and the next peak temperature occurs 24 hours later. Throughout the day, the temperature fluctuates between 14.5 °C and 28.5 °C.
All temperatures are given correct to one decimal place.
Show that .
(b) Find the value of .
(c) Find the value of .
(d) Find the smallest possible value of .
(e) Find the temperature at 06:00 (6 AM).
(f) Determine the number of hours, over a 24-hour period, for which the temperature is higher than 25 °C.
The period of the sinusoidal function is the time between consecutive peaks. The formula relating the period (P) to the constant 'b' is .
The amplitude 'a' is half the difference between the maximum and minimum values of the function.
The vertical shift 'd' represents the midline of the sinusoidal function, which is the average of the maximum and minimum values.
The function reaches its first maximum when the argument of the sine function, , equals . Use the given time of the first peak.
Substitute into the full temperature function with the values of you found.
Set and solve for . Remember that the sine function has multiple solutions within a 24-hour period. You'll need to find the two times within one cycle when the temperature equals 25 °C, and then consider the full 24-hour period if necessary (though for a 24-hour period with a 24-hour cycle, one cycle is enough).
Question 8
HardPaper 2 · calculator16 marksA company models the efficiency of a new production line by the function , where represents the output rate (in units per hour) after hours of operation. For mathematical analysis, we consider the function over its natural domain , .
For the graph of f,
write down the equation of the vertical asymptote;
find the equation of the horizontal asymptote.
Find .
Using an algebraic approach, show that the graph of is obtained by a reflection of the graph of f in the y-axis followed by a reflection in the x-axis.
The graphs of f and intersect at and , where .
Find the value of p and the value of q.
Hence, find the area enclosed by the graph of f and the graph of .
The vertical asymptote of a rational function occurs where the denominator is zero, provided the numerator is not also zero at that point.
To find the horizontal asymptote of a rational function where the degree of the numerator and denominator are the same, consider the ratio of the leading coefficients as .
To find the inverse function, replace with , then swap and , and finally rearrange the equation to make the subject again.
A reflection in the y-axis transforms to . A subsequent reflection in the x-axis transforms to . You need to show that this sequence of transformations results in .
The intersection points of a function and its inverse often lie on the line . You can solve to find these points.
The area enclosed by two curves and between and is given by . Use your GDC to evaluate the definite integral.
Question 9
MediumPaper 2 · calculator5 marksConsider the function .
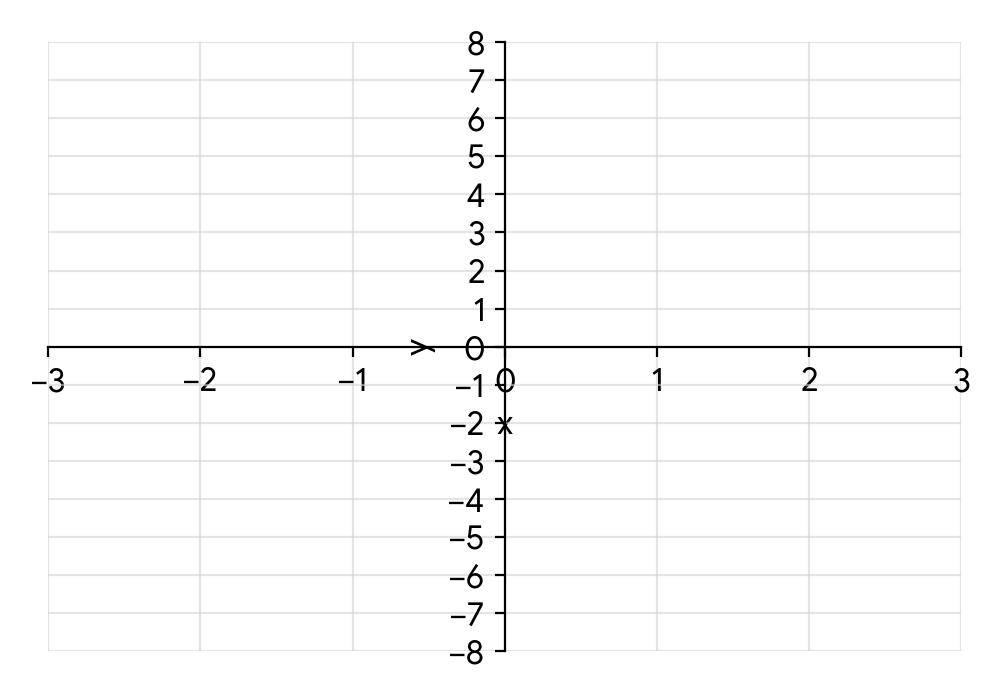
On the following axes, sketch the graph of for .
The function is defined by .
The graph of is obtained from the graph of (from part a) by a horizontal stretch with scale factor , followed by a vertical translation of units.
Find the value of and the value of .
To sketch the graph accurately, identify key features such as x-intercepts (roots), the y-intercept, local minimum or maximum points, and the function's values at the endpoints of the given domain. You may need to use a GDC to find the roots and the exact coordinates of the local minimum.
Consider how the input changes to for a horizontal stretch and how a constant is added or subtracted for a vertical translation. Compare the form of to .
Question 10
HardPaper 1 · no calculator10 marksDescribe the sequence of transformations that maps the graph of onto the graph of .
Describe the transformation that maps the graph of onto the graph of .
Describe the sequence of transformations that maps the graph of onto the graph of .
Describe the sequence of transformations that maps the graph of onto the graph of .
Describe the sequence of transformations that maps the graph of onto the graph of .
Consider the effect of the '+1' inside the function and the '-4' outside the function. Do these affect the x-values (horizontal) or y-values (vertical)?
What does a negative sign outside the function g(x) do to the y-coordinates of the graph?
Identify the two transformations. One affects the input (x-values) and the other affects the output (y-values). The order in which you state these two particular transformations does not matter.
There is a transformation inside the function brackets and another one outside. What do the '3' and the '-' signify?
Be careful with the order of horizontal transformations. It is often easier to first factor out the coefficient of x inside the function's argument. For example, rewrite as .
Question 11
MediumPaper 2 · calculator5 marksA scientist is studying the growth of a certain bacterial culture. The population, in thousands, at time hours is modeled by the function .
On the following axes, sketch the graph of for .
Another bacterial culture, observed under different conditions, has its population modeled by the function .
The graph of is obtained from the graph of by a horizontal stretch with scale factor , followed by a vertical translation of units.
Find the value of and the value of .
Use your GDC to find the key features of the function, such as the intercepts, local minimum, and the values at the endpoints of the given interval. Pay attention to the overall shape of the exponential function.
Recall how horizontal stretches and vertical translations affect the function notation. If is transformed to by a horizontal stretch with scale factor and a vertical translation of units, then . Substitute into the expression for and compare it to .
Question 12
MediumPaper 2 · calculator7 marksIn a simulation of a rotating antenna, its orientation is modeled by a complex number on the Argand diagram. Initially, the antenna's orientation is given by . The antenna's controller performs a series of rotations, and after such operations, its orientation is required to be pointing directly upwards along the imaginary axis, represented by the complex number .
Find the smallest positive integer value of for which the antenna's orientation is equal to .
Hence or otherwise, describe a single geometric transformation on the Argand diagram that maps to .
Recall De Moivre's theorem for powers of complex numbers. The target complex number has an argument of for any integer . Equate the arguments of and .
Consider the relationship between the arguments of and . A transformation that changes only the argument while keeping the modulus constant is a rotation. The angle of rotation is .
Question 13
MediumPaper 2 · calculator5 marksA scientist is modeling the growth of a certain bacterial colony. The population size, , at time hours, is given by the function for .
(a) On the following axes, sketch the graph of for .
Another bacterial colony, under different conditions, has its population size modeled by . It is observed that the growth curve of this second colony can be obtained from the graph of by a horizontal stretch with scale factor , followed by a vertical translation of units.
(b) Find the value of and the value of .
To sketch the graph accurately, identify key features such as the y-intercept, local minimum, and approximate roots. Also, calculate the function values at the endpoints of the given domain.
Recall that a horizontal stretch by a scale factor of transforms to . A vertical translation by units transforms to . Combine these transformations and compare the resulting expression with .
Question 14
MediumPaper 1 · no calculator7 marksThe graph of the function is translated by the vector .
(a) Describe this translation in words.
(b) Find the equation of the translated graph, giving your answer in the form .
(c) State the equations of the vertical and horizontal asymptotes of the translated graph.
A translation vector corresponds to a horizontal shift of units and a vertical shift of units. Pay attention to the signs of the components.
A translation by vector transforms to . Substitute the new expression for into the function and add the vertical shift. Then, combine the terms into a single fraction.
The asymptotes of the original graph are also translated by the same vector. Alternatively, you can find the asymptotes from the equation you found in part (b).
Question 15
MediumPaper 1 · no calculator4 marksList the transformations, in order, that transform the graph of to the graph of .
To identify the transformations correctly, you first need to rewrite the expression inside the logarithm in the form . Remember the conventional order of applying transformations: stretches/reflections first, then translations.
Question 16
MediumPaper 1 · no calculator9 marksA function is defined by .
(a) Write in the form , where , and are constants.
(b) Find the coordinates of the vertex of the graph of .
(c) Find the equation of the axis of symmetry of the graph of .
(d) State the range of .
The graph of is translated by the vector to form a curve representing a new function .
(e) Find in the form , where , and are constants.
Expand the squared bracket first, then multiply by the coefficient outside. Don't forget to combine the constant terms at the end.
Recall the vertex form of a quadratic, . The coordinates of the vertex are . Be careful with the signs.
The axis of symmetry is a vertical line that passes through the x-coordinate of the vertex of the parabola.
Consider the sign of the leading coefficient, . This tells you whether the parabola opens upwards or downwards, and therefore whether the vertex is a minimum or maximum point.
A translation by vector transforms a function to . Alternatively, you can find the new vertex by applying the translation to the original vertex and then writing the new equation in vertex form.
Question 17
MediumPaper 1 · no calculator7 marksA function is defined by for .
(a) Express in the form .
(b) The graph of is obtained from the graph of by a sequence of transformations. Describe fully this sequence of transformations.
To express a quadratic in vertex form, you need to complete the square. Start by factoring out the coefficient of the term from the first two terms. Alternatively, you can use the formula for the axis of symmetry, , to find the vertex.
Look at the vertex form you found in part (a), . Each of the parameters corresponds to a specific transformation of the base graph . Remember that the sign of 'a' also indicates a transformation.
Question 18
MediumPaper 1 · no calculator8 marksThe graph of a function has a local maximum at P, a local minimum at Q, a y-intercept at R and an x-intercept at S.
(a) The graph of is transformed to the graph of . Write down the coordinates of the images of the points P, Q, R, and S.
(b) The graph of is transformed to the graph of . Write down the coordinates of the images of the points P, Q, R, and S.
Consider the transformation . How does this affect a general point on the original graph? Apply this rule to each of the given points.
Consider the transformation . How does this affect a general point on the original graph? Identify the values of 'a' and 'b' and apply the transformation rule to each point.
Question 19
MediumPaper 1 · no calculator6 marksA function is defined by .
(a) Express in the form , where are integers.
(b) Write down the coordinates of the vertex of the graph of .
(c) The graph of a function is obtained from the graph of by a translation of . Find the coordinates of the vertex of the graph of .
To express a quadratic in vertex form, you can use the method of completing the square. Start by factoring out the coefficient of from the first two terms.
The vertex of a parabola in the form is given by the point .
A translation by a vector moves every point to a new point . Apply this to the vertex you found in part (b).
Question 20
MediumPaper 2 · calculator9 marks(a) A scientist is studying the population sizes of two bacterial cultures, A and B, in a controlled environment. The population sizes, in thousands, are modelled by the functions and respectively, where is the time in hours. Sketch the graphs of and on the same set of axes for . Clearly indicate any asymptotes and axis intercepts.
(b) Write down the equation of the vertical asymptote of the graph of .
(c) Describe a single transformation that maps the graph of onto the graph of .
(d) Use your sketch to find the time, , when the populations of culture A and culture B are equal.
Remember the domain restrictions for logarithmic functions. For , the argument must be positive. For , the argument must be positive. Identify the vertical asymptotes and calculate the -intercepts and -intercepts for each function. The intersection point is also important for a clear sketch.
The vertical asymptote of a logarithmic function occurs when the argument is equal to zero.
Consider how the argument of the logarithm changes from to . Think about reflections and translations. A reflection across a vertical line changes to .
The populations are equal when . On a sketch, this corresponds to the point of intersection of the two graphs.
No question on this page matches those filters. Try another difficulty or paper.
6 more Transformations of graphs (translation, reflections, stretches) questions in the app
Every answer is marked mark by mark, IB-style, and the AI tutor helps when you are stuck.
Where marks are lost
- Using your own wrong value after failing a "show that".
