Exponential & Logarithmic functions & their graphs: notes and practice questions
- Exponential functions: ().
Key features: growth/decay, horizontal asymptote at .
- Logarithmic functions: ().
Key features: vertical asymptote at .
- Graphs are inverses: reflects over .
How it is examined
Modelling contexts dominate: a growth or decay model with two data points, find the parameters, then predict. Paper 2. The horizontal asymptote of an exponential model is worth a mark and is routinely omitted from sketches. 5 to 8 marks.
is given.
- Exponential functions and their graphs: , ; .
- Logarithmic functions and their graphs: , ; , .
Linking questions
- Links to other subjects: radioactive decay, charging and discharging capacitors (physics); first order reactions and activation energy (chemistry); growth curves (biology).
- Aim 8: "exponential growth" used loosely in popular language.
Practice questions
30 questions · 1 easy · 25 medium · 4 hardQuestion 1
EasyPaper 2 · calculator5 marksA freshly baked cake is taken out of an oven and placed on a wire rack to cool in a kitchen.
The temperature of the cake, , after minutes is modelled by the function , for .
(a) Find the initial temperature of the cake.
(b) Find the temperature of the cake after 20 minutes.
(c) Write down the temperature of the kitchen.
The initial temperature occurs at the exact moment the cake is taken out of the oven, which corresponds to .
Substitute into the given temperature function and evaluate it using your calculator.
Consider what happens to the value of as becomes very large. What temperature will the cake eventually cool down to?
Question 2
MediumPaper 1 · no calculator5 marksIf the equation is said to have exactly one real solution, find the value of .
If an equation looks like a quadratic one, it can be recognized sometimes by a variable different than just .
Question 3
HardPaper 3 · calculator24 marksA biologist is modelling the growth of two different bacterial colonies. The first colony, A, grows such that its population at time is given by , where is a growth factor and . The second colony, B, grows linearly such that its population at time is .
Consider the cases where the growth factor and . On the same set of axes, sketch the following three graphs for :
Clearly label each graph with its equation and state the coordinates of any non-zero -axis intercepts.
In parts (b) and (c), consider the case where the growth factor .
Use calculus to find the minimum value of the expression , justifying that this value is a minimum.
Hence deduce that for all .
There exist values of for which the graph of and the line have different numbers of intersection points. The following table gives three intervals for the value of .
| Interval | Number of intersection points |
|---|---|
By investigating the graph of for different values of , write down the values of and .
In parts (e) and (f), consider .
For , a value of exists such that the line is a tangent to the graph of at a point P.
Find the exact coordinates of P and the exact value of .
Write down the exact set of values for such that the graphs of and have
(i) two intersection points;
(ii) no intersection points.
Ensure your sketch accurately reflects the general shape and relative positions of exponential functions with different bases and the line . Pay attention to intercepts and asymptotic behaviour.
Recall how to find local extrema using calculus by analyzing the first and second derivatives.
Consider the implications of the minimum value found in part (b) for the expression .
Visualize how the graph of changes as the value of changes, especially relative to the line . Consider the general shapes for and .
For tangency, both the function values and their derivatives must be equal at the point of contact. Let the point of tangency be .
Relate the critical value of found in part (e) to the number of intersection points. Consider the graphical behavior.
Relate the critical value of found in part (e) to the number of intersection points. Consider the graphical behavior.
Question 4
MediumPaper 1 · no calculator5 marksConsider the functions and , where is a real constant.
(a) Write down an expression for .
(b) Given that , find the value of .
To find , you need to substitute the entire function into the variable of the function .
Substitute into your expression from part (a) and set it equal to 36. Then, use the properties of exponents and logarithms to solve for .
Question 5
HardPaper 1 · no calculator12 marksConsider the functions , , and .
(a) Find the range of .
(b) Find the range of .
(c) Find the range of .
(d) Find an expression for .
(e) Solve the equation .
(f) Solve the inequality .
The function is a quadratic. What is the vertex of the parabola and which way does it open? This will tell you the maximum or minimum value.
The function is a reciprocal function. Consider the horizontal asymptote of the graph of . The function can take any value except the value of the horizontal asymptote.
The function is an exponential function. What is the range of the basic exponential function ? How does the '+1' transform this range?
To find the composite function , you need to substitute the expression for into the variable in the function .
Use your expression from part (d) and set it equal to -1. Then, solve the resulting equation for .
First, find the composite function . Then set up the inequality and solve for . Remember the properties of exponential functions and how to solve quadratic inequalities.
Question 6
MediumPaper 1 · no calculator13 marksThe functions and are defined by
, where
, where .
The graphs of and intersect at two distinct points.
(a) State the equation of the vertical asymptote to the graph of .
(b) (i) Show that, at the points of intersection, .
(b) (ii) Hence show that .
(b) (iii) Find the range of possible values of .
The graphs intersect at and , where .
(c) In the case where , find the value of . Express your answer in the form , where .
The vertical asymptote of a logarithmic function occurs where the argument is equal to zero.
Set and use the properties of logarithms to simplify the equation. Remember the power rule: .
The condition 'two distinct points of intersection' means the quadratic equation from part (b.i) must have two distinct real roots. What does this imply about the discriminant?
Solve the quadratic inequality found in part (b.ii). Remember to consider the given domain for .
Substitute into the quadratic equation from part (b.i). Solve this equation to find the values of and . Then calculate their difference.
Question 7
HardPaper 2 · calculator16 marksA chemical reaction is monitored over time. The concentration of a reactant, , in , at time minutes, is modelled by the function .
Initially, at , the concentration of the reactant was . After minutes, the concentration had dropped to . It is known that the concentration approaches a minimum value of as time increases.
(a) Find the value of
(i)
(ii)
(b) Use the model to estimate the concentration of the reactant after it has been reacting for minutes.
(c) Write down the equation of the horizontal asymptote of the graph of .
(d) State the meaning of the asymptote found in part (c) in the context of this problem.
(e) Find an expression for the rate of change of the concentration of the reactant after minutes.
(f) Find an expression for .
(g) Hence explain how the concentration of the reactant will vary if the reaction is left for a long time.
The minimum value that the concentration approaches as time increases corresponds to the constant term in the model. Use the initial condition to find .
Use the concentration value at minutes along with the value of you found to solve for . Remember to use logarithms.
Substitute and the values of and you found into the concentration model .
Consider what happens to the exponential term as approaches infinity when is negative.
The horizontal asymptote represents the limiting value of the concentration as time goes on indefinitely.
Differentiate the concentration function with respect to . Remember that and are constants.
Differentiate the expression for with respect to .
Analyze the signs of the first and second derivatives as . The first derivative tells you if the concentration is increasing or decreasing, and the second derivative tells you about the concavity (how the rate of change is changing).
Question 8
MediumPaper 1 · no calculator7 marksConsider the functions and where .
The graphs of and have a common tangent at .
(a) Find .
(b) Show that .
(c) Hence, find the value of .
Recall the rule for differentiating a natural logarithm function, and apply the chain rule.
For two functions to have a common tangent at a point, their gradients must be equal at that point. Set the derivatives of and equal to each other at .
For the functions to have a common tangent, they must also pass through the same point. This means their y-values are equal at . Set and substitute the value of you found in part (b).
Question 9
HardPaper 2 · calculator23 marksThe following table shows the annual revenue of a tech startup, Quantum Innovations, years after its launch in 2015.
| (years after 2015) | 0 | 2 | 4 | 6 | 8 |
|---|---|---|---|---|---|
| (revenue in millions of USD) | 1.5 | 2.8 | 4.2 | 5.5 | 7.1 |
A data analyst uses linear regression to model the revenue of Quantum Innovations using these data.
The analyst's model is .
(a)(i) Write down the value of and the value of .
(a)(ii) Interpret, in context, the value of .
(b) The analyst uses this model to predict the revenue of Quantum Innovations in the year 2030, where , and calculates a revenue of approximately million USD.
Comment on the reliability of the analyst's prediction.
(c)(i) A financial expert, Elena, develops an exponential model for Quantum Innovations' future revenue.
In this model, represents the revenue in millions of USD years after 2015, where .
Use Elena's model to predict the revenue of Quantum Innovations in the year 2035.
(c)(ii) Interpret, in context, the value in Elena's model.
(d) Another financial expert, Carlos, develops a third model for Quantum Innovations' revenue.
In this model, represents the revenue in millions of USD years after 2015, where .
Use Carlos's model to predict the revenue of Quantum Innovations in the year 2035.
(e) Determine the year in which the difference between the predictions from Elena's model and Carlos's model is greatest.
(f)(i) Find the value of
;
(f)(ii) Find the value of
.
(g) Compare and interpret, in context, the values of and .
Use your GDC's linear regression (LinReg(ax+b) ) function to find the values of and . Ensure you input the values as your independent variable and values as your dependent variable.
The value of represents the slope of the linear model. Think about what the slope means in terms of the variables (revenue) and (years).
Consider the range of the original data used to create the model. What happens when you make a prediction outside this range?
First, determine the value of that corresponds to the year 2035. Then substitute this value into Elena's exponential model.
In an exponential growth model , the base represents the growth factor. How is this related to a percentage growth rate?
As in part (c.i), first find the correct value of for the year 2035. Then substitute it into Carlos's model.
Define a difference function, for example, . Use your GDC to graph this function over the domain and find its maximum value. Remember to convert back to a year.
Use your GDC's numerical derivative function (e.g., nDeriv or dy/dx) to evaluate the derivative of Elena's model at . Alternatively, find the analytical derivative of and substitute .
Similar to part (f.i), use your GDC's numerical derivative function or find the analytical derivative of Carlos's model and substitute .
The derivative represents the instantaneous rate of change. Compare which model predicts a faster rate of revenue increase at and explain what that means for Quantum Innovations.
Question 10
MediumPaper 1 · no calculator9 marksConsider the function f defined by for .
The following diagram shows part of the graph of f which crosses the x-axis at point A, with coordinates . The line L is the tangent to the graph of f at the point B.
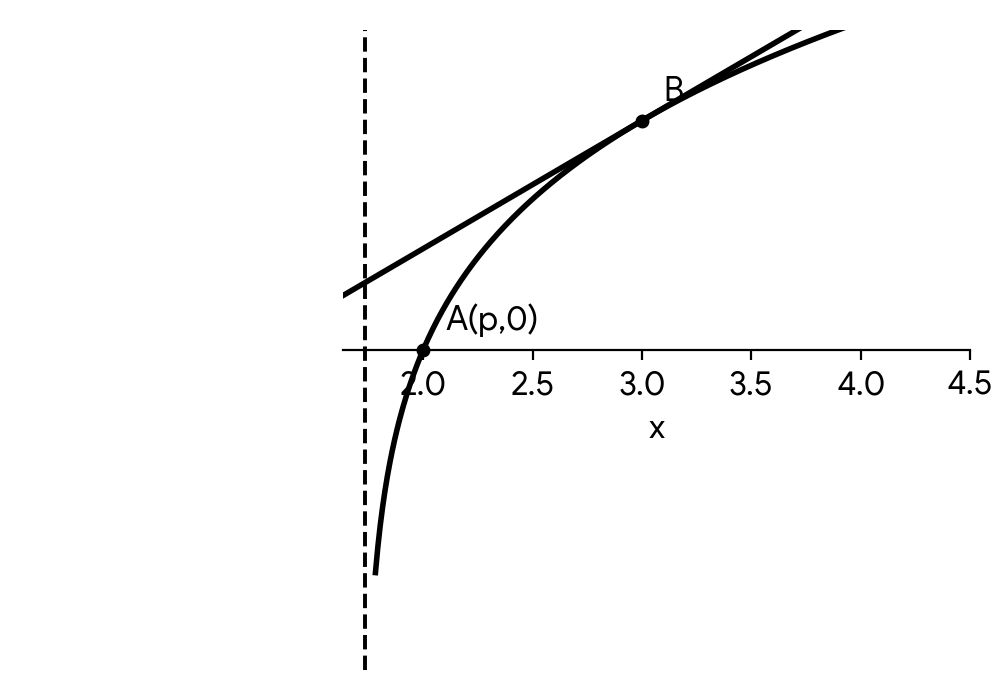
(a) Find the exact value of .
(b) Given that the gradient of L is , find the x-coordinate of B.
To find the x-intercept, you need to solve the equation . Remember the property that if , then .
First, you need to find the derivative of the function . Then, set the derivative equal to the given gradient and solve the resulting equation for .
Question 11
MediumPaper 1 · no calculator5 marksSolve the equation .
Notice that can be written as . Try making a substitution to turn this into a more familiar type of equation.
Question 12
MediumPaper 1 · no calculator15 marksA function is defined by , for .
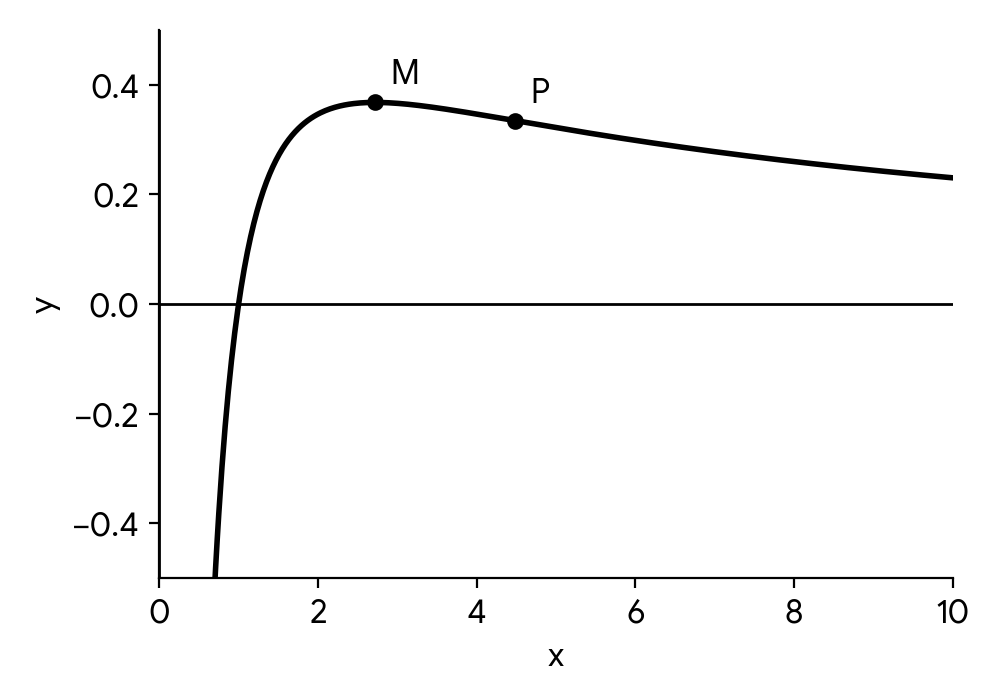
The following diagram shows part of the graph of .
(a) Find the coordinates of the x-intercept of the graph of .
(b) Find .
The graph of has a local maximum at point M.
(c) Hence, find the exact coordinates of M.
(d) (i) Show that .
The graph of has a point of inflection at point P.
(d) (ii) Hence, find the exact coordinates of P.
The x-intercept is the point where the graph crosses the x-axis. At this point, the y-coordinate is zero. Set and solve for .
To differentiate a function that is a fraction of two other functions, you should use the quotient rule: .
A local maximum occurs at a stationary point, where the first derivative is equal to zero. Set your expression for from part (b) to zero and solve for . Then, substitute this -value back into the original function to find the corresponding -coordinate.
You need to find the second derivative, , by differentiating . You will need to use the quotient rule again.
A point of inflection occurs where the second derivative changes sign. This can happen where . Set the expression for to zero and solve for . Then find the corresponding -coordinate.
Question 13
MediumPaper 2 · calculator5 marksA pharmaceutical company is testing a new drug. The concentration of the drug in a patient's bloodstream, , in mg/L, hours after administration, is modeled by the function , for .
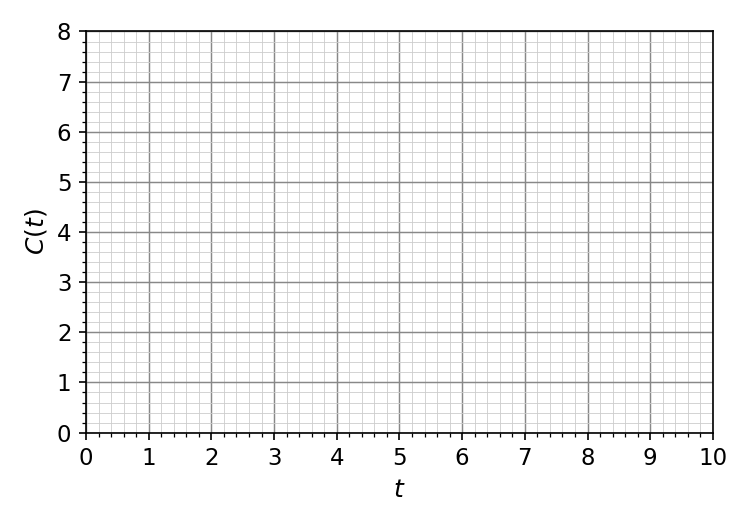
Sketch the graph of on the grid below.
(b) Find the time, in hours, at which the concentration of the drug in the bloodstream is at its maximum.
Use your GDC to plot the function. Pay attention to the domain, the general shape of the curve, the coordinates of the local maximum, and the values at the endpoints.
The maximum concentration occurs when the rate of change of concentration with respect to time is zero. This means finding the value of for which . Use your GDC's maximum finding feature or solve .
Question 14
MediumPaper 2 · calculator14 marksThe amount of a certain pollutant, in tonnes, in a lake weeks after a major clean-up operation began, can be modelled by , .
Find the initial amount of pollutant in the lake.
Find the amount of pollutant in the lake five weeks after the clean-up operation began.
Write down the value of .
Interpret the meaning of your answer to part (b) in the given context.
The clean-up operation is considered successful when the amount of pollutant in the lake is below 20 tonnes.
Find the least possible integer value of , in weeks, for which the amount of pollutant is below 20 tonnes.
As the clean-up operation continues indefinitely, the amount of pollutant in the lake approaches a constant level.
Find this constant level of pollutant.
Find the limit of as approaches infinity.
To find the initial amount, consider the value of at the start of the clean-up operation.
Substitute the given time value into the function and calculate the result.
First, find the derivative . Then, substitute into the derivative.
The derivative represents the rate of change. Consider what a negative rate means in this context and include units.
Set the function less than 20 and solve for . Remember to round up to the nearest integer for the 'least possible integer value'.
Consider what happens to the exponential term as time approaches infinity.
Consider what happens to the derivative function as time approaches infinity.
Question 15
MediumPaper 2 · calculator5 marksA chemical spill introduces a pollutant into a lake. The concentration of the pollutant, , in micrograms per litre (), days after the spill, is modelled by the function .
Initially, the concentration of the pollutant in the lake is .
(a) Write down the initial concentration of the pollutant.
After 5 days, the concentration is measured to be .
(b) Calculate the value of .
(c) Determine the number of days it takes for the concentration to fall to .
The initial concentration occurs when . Substitute into the given function or use the information provided directly.
Substitute the given values for , , and into the exponential decay formula. Then, use logarithms to solve for .
Use the calculated value of from part (b) and the initial concentration . Set to and solve for using logarithms.
Question 16
MediumPaper 2 · calculator5 marksA scientist is studying the growth of a certain bacterial culture. The population, in thousands, at time hours is modeled by the function .
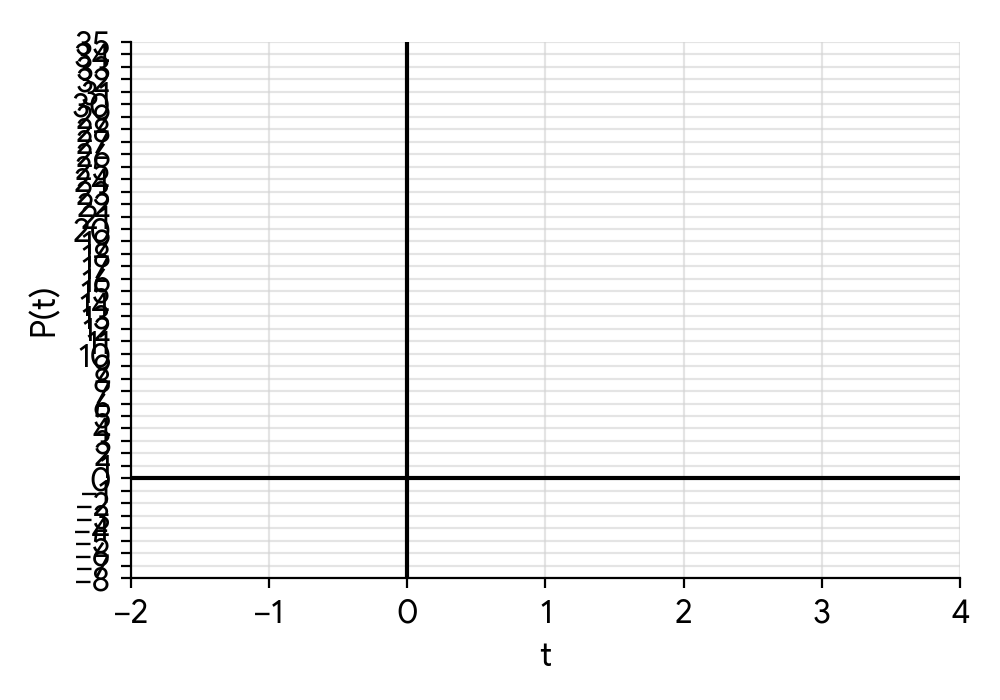
On the following axes, sketch the graph of for .
Another bacterial culture, observed under different conditions, has its population modeled by the function .
The graph of is obtained from the graph of by a horizontal stretch with scale factor , followed by a vertical translation of units.
Find the value of and the value of .
Use your GDC to find the key features of the function, such as the intercepts, local minimum, and the values at the endpoints of the given interval. Pay attention to the overall shape of the exponential function.
Recall how horizontal stretches and vertical translations affect the function notation. If is transformed to by a horizontal stretch with scale factor and a vertical translation of units, then . Substitute into the expression for and compare it to .
Question 17
MediumPaper 1 · no calculator4 marksList the transformations, in order, that transform the graph of to the graph of .
To identify the transformations correctly, you first need to rewrite the expression inside the logarithm in the form . Remember the conventional order of applying transformations: stretches/reflections first, then translations.
Question 18
MediumPaper 2 · calculator5 marks(a) A new species of invasive algae is introduced into a lake. Its biomass, in kg, at time weeks, is modelled by the function . Simultaneously, the concentration of a specific nutrient, in arbitrary units, crucial for the algae's growth, is modelled by . Scientists are interested in finding the time(s) when the algae's biomass equals the nutrient concentration.
(i) On the same set of axes, sketch the graphs of and for . Clearly label any axis intercepts and the intersection point(s).
(ii) Hence, use your GDC to find the value of when the algae's biomass equals the nutrient concentration. Give your answer to three significant figures.
For the sketch, determine the - and -intercepts for each function. Remember that the domain for requires . The general shape of an exponential function and a logarithmic function should be known.
To find the value of when the biomass equals the nutrient concentration, you need to solve the equation . Use the 'intersect' function on your GDC after graphing both functions.
Question 19
MediumPaper 2 · calculator9 marks(a) A scientist is studying the population sizes of two bacterial cultures, A and B, in a controlled environment. The population sizes, in thousands, are modelled by the functions and respectively, where is the time in hours. Sketch the graphs of and on the same set of axes for . Clearly indicate any asymptotes and axis intercepts.
(b) Write down the equation of the vertical asymptote of the graph of .
(c) Describe a single transformation that maps the graph of onto the graph of .
(d) Use your sketch to find the time, , when the populations of culture A and culture B are equal.
Remember the domain restrictions for logarithmic functions. For , the argument must be positive. For , the argument must be positive. Identify the vertical asymptotes and calculate the -intercepts and -intercepts for each function. The intersection point is also important for a clear sketch.
The vertical asymptote of a logarithmic function occurs when the argument is equal to zero.
Consider how the argument of the logarithm changes from to . Think about reflections and translations. A reflection across a vertical line changes to .
The populations are equal when . On a sketch, this corresponds to the point of intersection of the two graphs.
Question 20
MediumPaper 1 · no calculator3 marksThe graph of the function is transformed to obtain the graph of the function . The graph of is first reflected in the -axis, then translated by the vector , and finally stretched vertically by a factor of 2.
Find the equation of the function .
Remember the order of transformations is important. A reflection in the y-axis affects the 'x' term. A horizontal translation also affects the 'x' term. A vertical stretch affects the entire function.
No question on this page matches those filters. Try another difficulty or paper.
10 more Exponential & Logarithmic functions & their graphs questions in the app
Every answer is marked mark by mark, IB-style, and the AI tutor helps when you are stuck.
Where marks are lost
- Using your own wrong value after failing a "show that".
