Solving inequalities (graphically & analytically): notes and practice questions
- Inequalities can be solved graphically using a GDC by plotting functions and finding intersections, or analytically.
- Quadratic inequalities can be solved by sketching the parabola based on its roots and concavity, or by using a sign diagram.
- Polynomial inequalities require factorizing, identifying roots, and using a sign diagram, noting sign changes at odd-powered roots and no change at even-powered roots.
- Modulus inequalities can be solved using algebraic properties, squaring both sides (if non-negative), or graphically.
- Rational inequalities involve moving all terms to one side, creating a single fraction, and using a sign diagram with critical values from both numerator and denominator zeros.
How it is examined
Degree 3 is the algebraic ceiling; anything harder is a GDC question. The answer is a set of intervals and it has to be written as one, using the IB's interval notation. The reliable loss is multiplying both sides by something that can be negative. 4 to 6 marks.
Solutions of , both graphically and analytically.
Linking questions
- Feeds AHL 2.16, where the same skill is applied to modulus inequalities.
Practice questions
39 questions · 28 medium · 11 hardQuestion 1
MediumPaper 1 · no calculator6 marks(a) Using an algebraic method, solve the inequality
Begin by rewriting the inequality in the form . Then, use the factor theorem to find one integer root of the polynomial . This will allow you to factorize the polynomial and find all its roots. Finally, use a sign table or a sketch of the graph to identify the intervals that satisfy the inequality.
Question 2
HardPaper 3 · calculator24 marksA biologist is modelling the growth of two different bacterial colonies. The first colony, A, grows such that its population at time is given by , where is a growth factor and . The second colony, B, grows linearly such that its population at time is .
Consider the cases where the growth factor and . On the same set of axes, sketch the following three graphs for :
Clearly label each graph with its equation and state the coordinates of any non-zero -axis intercepts.
In parts (b) and (c), consider the case where the growth factor .
Use calculus to find the minimum value of the expression , justifying that this value is a minimum.
Hence deduce that for all .
There exist values of for which the graph of and the line have different numbers of intersection points. The following table gives three intervals for the value of .
| Interval | Number of intersection points |
|---|---|
By investigating the graph of for different values of , write down the values of and .
In parts (e) and (f), consider .
For , a value of exists such that the line is a tangent to the graph of at a point P.
Find the exact coordinates of P and the exact value of .
Write down the exact set of values for such that the graphs of and have
(i) two intersection points;
(ii) no intersection points.
Ensure your sketch accurately reflects the general shape and relative positions of exponential functions with different bases and the line . Pay attention to intercepts and asymptotic behaviour.
Recall how to find local extrema using calculus by analyzing the first and second derivatives.
Consider the implications of the minimum value found in part (b) for the expression .
Visualize how the graph of changes as the value of changes, especially relative to the line . Consider the general shapes for and .
For tangency, both the function values and their derivatives must be equal at the point of contact. Let the point of tangency be .
Relate the critical value of found in part (e) to the number of intersection points. Consider the graphical behavior.
Relate the critical value of found in part (e) to the number of intersection points. Consider the graphical behavior.
Question 3
MediumPaper 2 · calculator4 marksA scientist is modeling the behavior of a particle in a fluctuating electromagnetic field. The particle's position over time can be described by a quadratic equation involving a field strength parameter . The equation is given by , where .
(a) Write down an expression for the product of the roots of this equation, in terms of .
(b) Hence or otherwise, determine the values of such that the equation has one positive and one negative real root.
Recall the relationship between the coefficients of a quadratic equation and its roots. The product of the roots is given by .
For a quadratic equation to have one positive and one negative real root, their product must be negative. Consider the critical values where the expression for the product of roots changes sign.
Question 4
HardPaper 1 · no calculator9 marksA function is defined by , where .
The graph of is shown below.
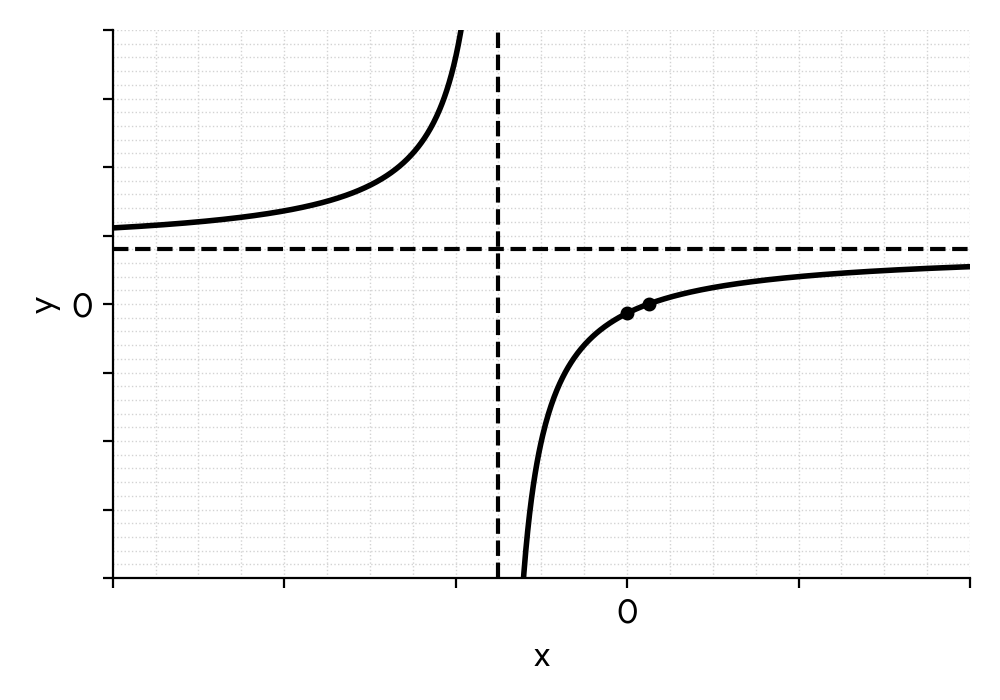
(a) Write down the equation of the horizontal asymptote.
Consider the function , where .
(i) Write down the number of solutions to for .
(ii) Determine the value of such that has only one solution for .
(iii) Determine the range of values for for which has two distinct solutions for .
The horizontal asymptote is determined by the behavior of the function as approaches . For a rational function where the degree of the numerator and denominator are the same, the asymptote is the ratio of the leading coefficients.
The line passes through the y-intercept of . Sketch a line with a negative slope passing through this point on the given graph. How many times does it intersect the curve ?
A single solution occurs when the line is tangent to the curve . Since the line always passes through the y-intercept of the curve, the point of tangency must be the y-intercept. Therefore, the slope of the line, , must be equal to the gradient of the curve at that point. Alternatively, you can set up the equation , rearrange it into a quadratic, and use the discriminant or analyze the roots.
From the previous part, you found the two solutions for in terms of . One solution is always . For there to be two distinct solutions for , what condition must the other solution satisfy?
Question 5
MediumPaper 1 · no calculator7 marksThe graphs of the functions and intersect at two distinct points.
(a) Find the set of possible values for .
(b) Consider the case when . The x-coordinates of the intersection points can be written in the form , where . Find the values of and .
The number of intersection points between two graphs is related to the number of solutions to the equation . What does 'two distinct points' tell you about the discriminant of the resulting quadratic equation? Don't forget to consider any special cases for the parameter .
Substitute the given value of into the equation you found in part (a). Then, use the quadratic formula to find the roots and compare them to the given form.
Question 6
HardPaper 2 · calculator20 marksA civil engineer is analyzing the structural integrity of a new bridge design. The deflection of a certain point on the bridge, , in millimeters, is modeled by the function , where represents the horizontal distance in meters from a central support. The model is valid for , , .
Find the value of and the value of .
Find an expression for .
The graph of has exactly one point of inflexion.
Find the x-coordinate of the point of inflexion.
Sketch the graph of for , showing the values of any axes intercepts, the coordinates of any local maxima and local minima (if they exist), and giving the equations of any asymptotes.
Consider a related model for stress distribution, for , .
Find the equations of all the asymptotes on the graph of .
The engineer needs to identify the regions where the bridge deflection is less than mm. Solve for .
The function is undefined when the denominator is zero. Set the denominator equal to zero and solve for x.
Use the quotient rule for differentiation: If , then .
A point of inflexion occurs where the second derivative, , is zero or undefined, and the concavity changes. You may need to use a GDC to find the root of .
Identify vertical and horizontal asymptotes, x and y-intercepts. Determine if there are any local maxima or minima by analyzing the first derivative. Plot key points and sketch the curve's behavior around asymptotes.
For vertical asymptotes, set the denominator to zero. For oblique asymptotes, perform polynomial long division to express in the form .
Rearrange the inequality to have zero on one side. Find the critical values by setting the numerator and denominator to zero. Use a sign table or graph to determine the intervals where the inequality holds.
Question 7
MediumPaper 1 · no calculator7 marksConsider the functions and , where and .
The graph of is obtained by two transformations of the graph of .
Describe these two transformations.
The -intercept of the graph of is at .
Given that the maximum value of is less than or equal to 1, find the largest possible value of .
Look at how the input to the cosine function has changed, and how the entire function has been shifted vertically.
First, determine the maximum value of in terms of . Use the given condition to find the minimum possible value for . Then, calculate the y-intercept, , and use your result for to find the largest possible value of .
Question 8
HardPaper 2 · calculator9 marksThe sum of the first terms of a geometric sequence is given by . This sequence models the amount of plastic (in kg) removed from a river by an environmental initiative each month.
(a) Find the amount of plastic removed in the first month, .
(b) Calculate the total amount of plastic the initiative expects to remove if it continues indefinitely.
(c) The initiative aims to remove an amount of plastic that is within of its total expected removal goal. Find the least number of months, , for which the total amount of plastic removed, , is within of the total expected removal goal.
Recall that the first term of a sequence, , can be found by evaluating the sum formula for , or by directly substituting into the general term of the sum.
Identify the first term () and the common ratio () of the geometric sequence. Then use the formula for the sum to infinity, .
The condition 'within ' means the absolute difference between the total expected removal () and the amount removed in months () must be less than . Set up an inequality: . Remember that represents the sum of terms from to infinity.
Question 9
MediumPaper 1 · no calculator13 marksThe functions and are defined by
, where
, where .
The graphs of and intersect at two distinct points.
(a) State the equation of the vertical asymptote to the graph of .
(b) (i) Show that, at the points of intersection, .
(b) (ii) Hence show that .
(b) (iii) Find the range of possible values of .
The graphs intersect at and , where .
(c) In the case where , find the value of . Express your answer in the form , where .
The vertical asymptote of a logarithmic function occurs where the argument is equal to zero.
Set and use the properties of logarithms to simplify the equation. Remember the power rule: .
The condition 'two distinct points of intersection' means the quadratic equation from part (b.i) must have two distinct real roots. What does this imply about the discriminant?
Solve the quadratic inequality found in part (b.ii). Remember to consider the given domain for .
Substitute into the quadratic equation from part (b.i). Solve this equation to find the values of and . Then calculate their difference.
Question 10
HardPaper 2 · calculator15 marksA team of engineers is testing two autonomous robots, Alpha and Beta, on a straight track. Their positions are measured as the distance from a fixed starting point. The experiment runs for 10 minutes.
The position of Robot Alpha, metres, at time minutes can be modelled by the function , where .
The position of Robot Beta, metres, at time minutes can be modelled by the function , where .
Use the engineers' models to find the initial position of
(i) Robot Beta;
(ii) Robot Alpha correct to three significant figures.
Find the values of when Robot Alpha and Robot Beta are at the same position. Give your answers correct to three significant figures.
For , prove that Robot Alpha was always ahead of Robot Beta.
For , find the total amount of time when the speed of Robot Beta was greater than the speed of Robot Alpha. Give your answer correct to three significant figures.
The initial position corresponds to the time . Substitute this value into the function for Robot Beta.
Substitute into the function for Robot Alpha. Remember that the argument of the sine function is in radians.
Set the two position functions equal to each other, . This equation will involve a trigonometric term and a linear term, so you will need to use your GDC to find the solutions within the given domain .
To prove Robot Alpha was always ahead, show that for . Consider the minimum value of the trigonometric term in the difference function.
Speed is the magnitude of velocity, which is the derivative of position with respect to time. Find and . Then solve the inequality for within the given domain. This will involve a trigonometric inequality.
Question 11
MediumPaper 1 · no calculator12 marksA function is defined by , where . The graph of is tangent to the line with equation .
(a) Show that .
(b) The function can be expressed in the form , where .
Find the value of and the value of .
(c) The function can also be expressed in the form , where .
Find the value of and the value of .
(d) Hence find the values of where the graph of is both positive and decreasing.
For a line to be tangent to a curve, they must intersect at exactly one point. Set the equations for the curve and the line equal to each other and use the discriminant of the resulting quadratic equation.
Substitute the value of you found in part (a) into the expression for and then factorize the quadratic to find its roots.
You can find the vertex of the parabola by completing the square, using the formula , or by finding the midpoint of the roots found in part (b).
Consider the information you found in the previous parts. Where are the roots (from part b)? This tells you where the function is positive or negative. Where is the vertex (from part c)? This tells you where the function is increasing or decreasing. Find the interval of x-values that satisfies both conditions.
Question 12
HardPaper 2 · calculator19 marksA new automated manufacturing process produces components. The time, in minutes, taken for a critical assembly step is modelled by a continuous random variable , with a probability density function defined by
Find the exact value of .
Find .
The assembly step is considered "efficient" if it takes less than 1.5 minutes. Each assembly step is independent. Determine the least number of assembly steps required to be 99% sure of at least one efficient step.
Ten assembly steps were conducted.
Find the probability that exactly three steps were efficient.
Write down the number of ways these three efficient steps could have occurred consecutively in a batch of 10.
Now consider a batch of assembly steps where it is given that exactly three efficient steps have occurred.
Write down an expression for the number of ways these three efficient steps could have occurred consecutively.
Find the greatest value of such that the probability of three consecutive efficient steps is more than 0.05, given that exactly three efficient steps have occurred in the batch.
Recall that the expected value for a continuous random variable is given by the integral of over its domain. Consider using a substitution method for integration.
Integrate the probability density function from the lower limit to 1.5. Recall the integral of .
Let be the probability of an efficient step from part (b). The probability of at least one efficient step in trials is . Set up an inequality and solve for .
This is a binomial probability problem. Identify , , and , then use the binomial probability formula .
Consider placing a block of 3 consecutive successes within the 10 trials. If the block starts at position 1, 2, etc., how many starting positions are there?
Generalize your approach from part (e) for trials instead of 10.
This is a conditional probability problem. The probability is the ratio of (number of ways for 3 consecutive successes) to (total number of ways for exactly 3 successes in trials). Set up an inequality and solve for .
Question 13
MediumPaper 1 · no calculator16 marksConsider the arithmetic sequence , where .
Show that .
Consider the geometric sequence , where .
Show that .
The first term of both sequences is . It is given that and that is a real number.
Show that .
Consider the case where , and .
(i) Write down the first four terms of the arithmetic sequence.
(ii) Write down the first four terms of the geometric sequence.
A new sequence is formed by combining the terms of the arithmetic sequence, , and the geometric sequence, , from part (d). The terms of are given by .
(i) Show that is an arithmetic sequence and find its common difference.
(ii) Hence, find the value of .
Recall the definition of an arithmetic sequence. What is the relationship between consecutive terms?
Recall the definition of a geometric sequence. What is the relationship between consecutive terms?
Use the relationships from parts (a) and (b). Consider the condition for the terms of the geometric sequence to be real numbers.
Use the information given and the result from part (a) to find the second term, and then the common difference.
Use the information given and the result from part (b) to find the second term, and then the common ratio.
Calculate the first few terms of the sequence and check if the difference between consecutive terms is constant.
Use the formula for the sum of the first n terms of an arithmetic sequence.
Question 14
HardPaper 1 · no calculator12 marksConsider the functions , , and .
(a) Find the range of .
(b) Find the range of .
(c) Find the range of .
(d) Find an expression for .
(e) Solve the equation .
(f) Solve the inequality .
The function is a quadratic. What is the vertex of the parabola and which way does it open? This will tell you the maximum or minimum value.
The function is a reciprocal function. Consider the horizontal asymptote of the graph of . The function can take any value except the value of the horizontal asymptote.
The function is an exponential function. What is the range of the basic exponential function ? How does the '+1' transform this range?
To find the composite function , you need to substitute the expression for into the variable in the function .
Use your expression from part (d) and set it equal to -1. Then, solve the resulting equation for .
First, find the composite function . Then set up the inequality and solve for . Remember the properties of exponential functions and how to solve quadratic inequalities.
Question 15
MediumPaper 1 · no calculator6 marksFind the set of values of for which the equation has at least one real solution for .
The equation can be rearranged into a quadratic form. What variable would you use for the substitution? For a quadratic equation to have real solutions, what condition must its discriminant satisfy? Also, consider any restrictions on the value of from the original equation.
Question 16
HardPaper 1 · no calculator10 marksThe depth of water, metres, in a harbour on a particular day is modelled by the function , for , where is the number of hours after midnight.
The graph of is shown below.
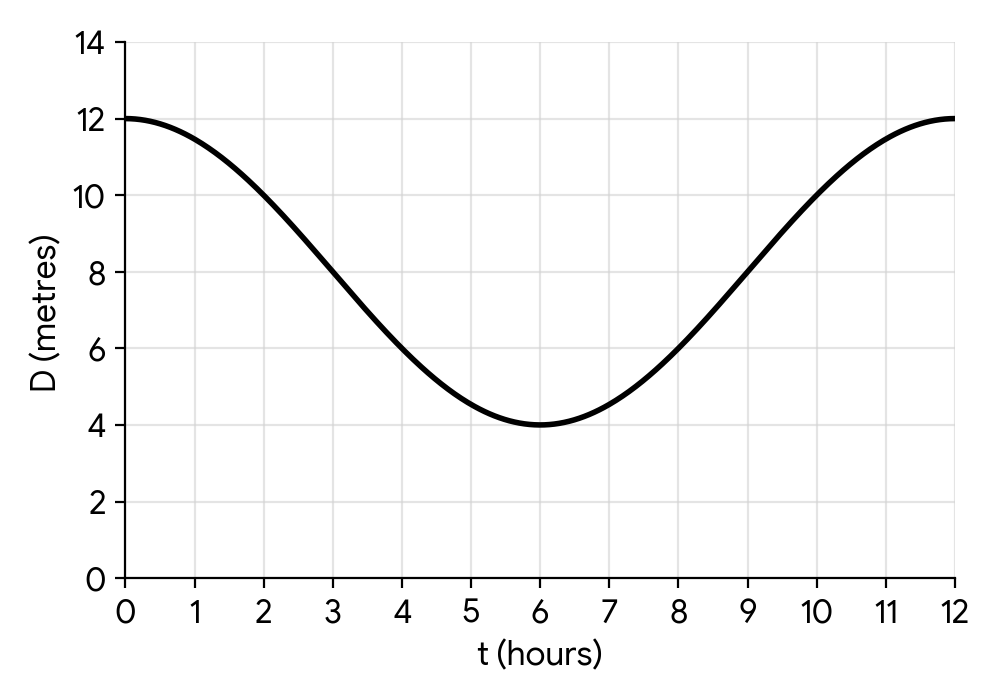
The graph has a maximum point at and a minimum point at .
(a) State:
i) the range of .
ii) the period of .
(b) Hence, find the values of , and .
(c) A ship requires a water depth of at least 10 metres to be able to enter the harbour. Find the time intervals, during the first 12 hours, when the ship can enter.
The range is the set of all possible output values (y-values), which for this graph is from the minimum depth to the maximum depth.
The period is the length of one full cycle. The time taken to go from a maximum to the next minimum is half a period.
The amplitude and the principal axis can be found from the maximum and minimum values. The parameter is related to the period.
Set up an inequality and solve for . First, solve the corresponding equation to find the boundary points of the intervals.
Question 17
MediumPaper 1 · no calculator5 marksSolve the inequality .
The function is defined by , where .
Find the least value of for which exists, justifying your answer.
First, find the roots of the corresponding quadratic equation . Then, consider the shape of the parabola (does it open upwards or downwards?) to determine the intervals where the function's value is positive.
For an inverse function to exist, the original function must be one-to-one. Also, remember the condition for the expression inside a square root. How does this relate to your answer in part (a)?
Question 18
HardPaper 2 · calculator19 marks(a) A deep-sea submersible's vertical displacement, in metres, from a reference depth is given by for time minutes. Positive indicates the submersible is above the reference depth, and negative indicates it is below.
Find the submersible's vertical velocity and acceleration at any time .
(b) Find the time intervals during when the submersible is moving upwards.
(c) Determine the time intervals during when the submersible's vertical velocity is decreasing.
(d) Calculate the total vertical distance travelled by the submersible during the time . Give your answer to three significant figures.
Remember that velocity is the first derivative of displacement with respect to time, and acceleration is the second derivative of displacement (or the first derivative of velocity) with respect to time. Apply the chain rule where necessary.
The submersible is moving upwards when its vertical velocity is positive. Set and use the identity to transform the inequality into a quadratic in terms of . Solve the quadratic inequality and then find the corresponding values of in the given domain.
The submersible's vertical velocity is decreasing when its acceleration is negative. Set and solve the trigonometric inequality in the given domain. You might need to use a graph or the unit circle to find the intervals.
To find the total distance travelled, you need to integrate the absolute value of the velocity function, . This means you must first find the times when the velocity is zero (the turning points) within the interval . Then, split the integral into sub-intervals where is consistently positive or negative, and sum the absolute values of the displacements in each sub-interval.
Question 19
MediumPaper 1 · no calculator7 marksA student claims that for all integers .
(a) Show that for all integers .
(b) Use mathematical induction and the result from part (a) to prove that the student's claim is valid for all integers .
Expand the right-hand side of the inequality. Then, rearrange the inequality to form a quadratic in terms of n. Consider the properties of this quadratic function for the given domain of n.
Follow the standard steps for proof by induction. First, show the base case is true (n=5). Then, assume the statement is true for n=k. For the inductive step, you need to show it's true for n=k+1. Start with and use your assumption and the result from part (a) to show it's greater than .
Question 20
HardPaper 3 · calculator27 marksA company is designing a new power generator. The power output, , in megawatts (MW), of a prototype generator at time hours after startup is modelled by the function , where , is a control parameter, and is a constant representing the initial power. For parts (a) to (e), assume .
On separate axes, sketch the graph of showing the value of the -intercept and the coordinates of any points with zero gradient, for
(i) ;
(ii) .
Write down an expression for .
Hence, or otherwise, find the set of values of such that the graph of has
(i) a point of inflexion with zero gradient;
(ii) one local maximum point and one local minimum point;
(iii) no points where the gradient is equal to zero.
Given that the graph of has one local maximum point and one local minimum point, show that
(i) the -coordinate of the local maximum point is ;
(ii) the -coordinate of the local minimum point is .
Hence, for , find the set of values of such that the graph of has
(i) exactly one -axis intercept;
(ii) exactly two -axis intercepts;
(iii) exactly three -axis intercepts.
Consider a modified power output function for and where . Find all conditions on and such that the graph of has exactly one -axis intercept, explaining your reasoning.
To sketch the graph, first find the derivative and set it to zero to find the critical points. Evaluate at these points to find the coordinates of local maxima and minima. Also, find the -intercept by setting .
Similar to part (a.i), find the critical points and their corresponding -values. Remember to use exact values where possible, and approximate for plotting if necessary.
Recall the power rule for differentiation.
A point of inflexion with zero gradient occurs when has a repeated root, which also implies at that point.
Local maximum and minimum points occur when has two distinct real roots.
No points with zero gradient means has no real solutions.
From part (c.ii), the critical points are . Determine which one corresponds to a local maximum by considering the shape of a positive cubic or using the second derivative test. Then substitute that -value into .
Similar to part (d.i), substitute the -value for the local minimum into .
For a cubic function with local maximum and minimum, it has exactly one -axis intercept if either the local minimum is above the -axis or the local maximum is below the -axis.
A cubic function with local maximum and minimum has exactly two -axis intercepts if either the local minimum is on the -axis or the local maximum is on the -axis.
A cubic function with local maximum and minimum has exactly three -axis intercepts if the local minimum is below the -axis AND the local maximum is above the -axis.
Consider two cases for : and . For , analyze the derivative . For , use the -coordinates of the local maximum and minimum points, similar to part (e).
No question on this page matches those filters. Try another difficulty or paper.
19 more Solving inequalities (graphically & analytically) questions in the app
Every answer is marked mark by mark, IB-style, and the AI tutor helps when you are stuck.
Where marks are lost
- Using your own wrong value after failing a "show that".
