Measures of central tendency & measures of dispersion (std. Dev, var, IQR): notes and practice questions
- Central Tendency:
- Mean: Average of the data.
- Median: Middle value when data is sorted.
- Mode: Most frequent value.
- Dispersion:
- Variance: Measure of data spread, calculated as the average of squared deviations from the mean.
- Standard Deviation (SD): Square root of variance, indicating how much data deviates from the mean.
- Interquartile Range (IQR): Difference between the third and first quartiles, showing the spread of the middle 50% of data.
How it is examined
The quartile caveat means a mark scheme should accept a by-hand quartile that differs from the GDC's. Paper 2, 4 to 6 marks.
The IQR () and the mean of grouped data are given. The standard deviation and variance formulas are not given at SL. They appear only in the HL-only part of topic 4 in the booklet (AHL 4.14), so an SL student is expected to get them from the GDC and an SL question must not require the formula.
- Measures of central tendency (mean, median and mode).
- Estimation of mean from grouped data.
- Modal class.
- Measures of dispersion (interquartile range, standard deviation and variance).
Linking questions
- Links to other subjects: descriptive statistics (sciences, individuals and societies); consumer price index (economics).
Practice questions
38 questions · 5 easy · 32 medium · 1 hardQuestion 1
EasyPaper 2 · calculator4 marksA local library tracks the number of books borrowed by its members in one month. The data for 120 members is shown in the following table.
| Number of Books (x) | 0 | 1 | 2 | 3 | 4 | 5 |
|---|---|---|---|---|---|---|
| Frequency (f) | 15 | 28 | 35 | 22 | 12 | 8 |
One of the members is chosen at random.
(a) Find the probability that this member borrowed fewer than 2 books.
(b) Calculate the mean number of books borrowed per member.
To find the probability, divide the number of members who meet the condition ('fewer than 2 books') by the total number of members. 'Fewer than 2' means 0 or 1 book.
The mean of a frequency distribution is calculated using the formula . You will need to use your calculator for this.
Question 2
MediumPaper 1 · no calculator7 marksA biologist records the number of eggs in the nests of a certain species of bird. The results for 25 nests are shown in the following frequency table.
| Number of eggs (x) | 1 | 2 | 3 | 4 | 5 |
|---|---|---|---|---|---|
| Frequency (f) | p | 6 | q | 4 | 2 |
It is given that the mean number of eggs per nest is 2.6.
(a) Find the value of p and the value of q.
The biologist enters the data into a competition. The competition score is calculated using the formula , where is the number of eggs in a nest.
(b) Find the mean competition score.
You are given two key pieces of information: the total number of nests and the mean number of eggs. Use these to set up two separate equations involving p and q. Then, solve these equations simultaneously.
Recall the effect of a linear transformation on the mean of a dataset. If each data point is transformed to , how does the mean change?
Question 3
HardPaper 1 · no calculator8 marksA set of 12 spherical Matryoshka dolls, , are designed to fit inside one another.
The smallest doll, , has a radius of 2 cm.
The radius of each subsequent doll is 20% larger than the radius of doll , for .
(a) (i) Show that the volume of doll is cm.
(ii) Hence, find the mean volume of the twelve dolls, giving your answer in the form cm, where .
(b) Find the median volume of the twelve dolls, giving your answer in the form cm, where .
First, find the general formula for the radius of the nth doll, . Remember that the radii form a geometric sequence. Then, use the formula for the volume of a sphere, , and substitute your expression for .
The mean is the total sum divided by the number of items. The volumes form a geometric sequence. Use the formula for the sum of a geometric series, , to find the total volume of the 12 dolls. Then divide by 12.
For an even number of terms (12 dolls), the median is the average of the two middle terms. Identify which two terms are the middle ones and calculate their average volume.
Question 4
EasyPaper 1 · no calculator6 marksA student, Chloe, records the number of hours she spends studying each day for 11 consecutive days. Her records are as follows:
3, 5, 2, 4, 5, 6, 3, 5, 7, 2, 4.
(a) Find the mode of the number of hours Chloe studied.
(b) Find the median number of hours Chloe studied.
(c) Calculate the mean number of hours Chloe studied.
(d) Find the range of the number of hours Chloe studied.
The mode is the value that appears most frequently in a data set.
To find the median, you must first arrange the data in ascending order. The median is the middle value.
The mean is the sum of all the values divided by the number of values.
The range is the difference between the highest and lowest values in the data set.
Question 5
MediumPaper 1 · no calculator21 marksA new coffee shop records the number of customers, , per hour during its 120 opening hours in a week. The number of customers per hour is shown in the following frequency table.
| Number of customers () | Frequency (hours) |
|---|---|
| 15 | |
| 28 | |
| 22 | |
| 13 |
(a) Find the value of .
(b) Write down the modal class.
The following cumulative frequency diagram also displays these data.
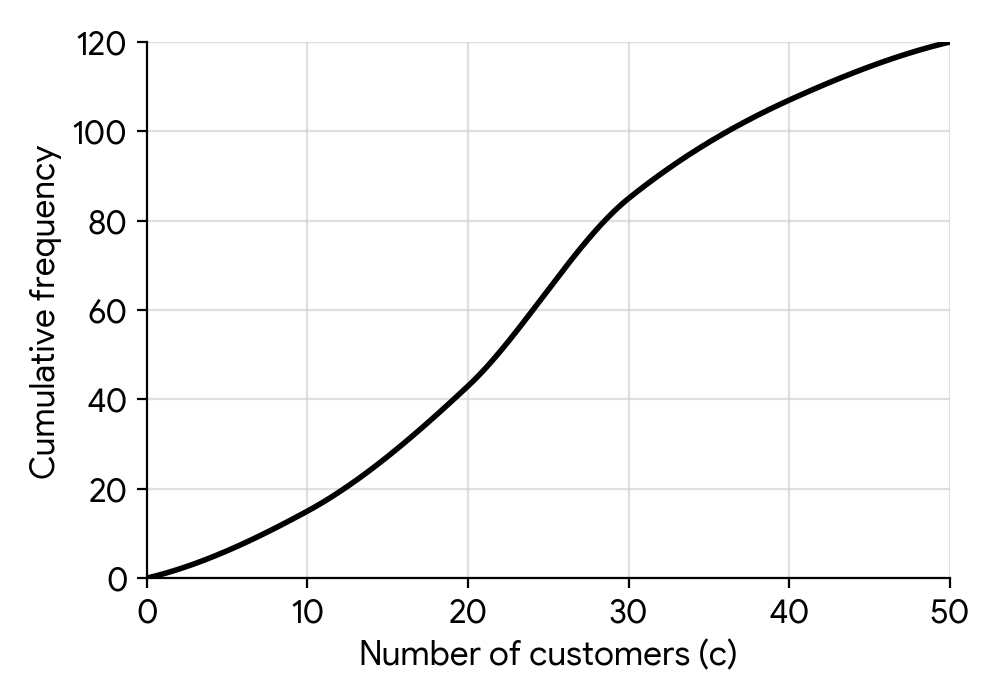
(c) Use the cumulative frequency curve to estimate the median number of customers per hour.
(d) The coffee shop is considered 'busy' when there are more than 35 customers. Use the cumulative frequency curve to estimate the number of hours the coffee shop was busy.
The coffee shop manager wants to survey customers about their experience.
(e) State one disadvantage of surveying only the customers who arrive between 8 am and 9 am on a Monday.
(f) Describe how the manager could use systematic sampling to survey customers throughout a single day.
The total number of customers for the week was 2900. The following box and whisker diagram displays the amount of money, in USD, spent by customers during their visit.
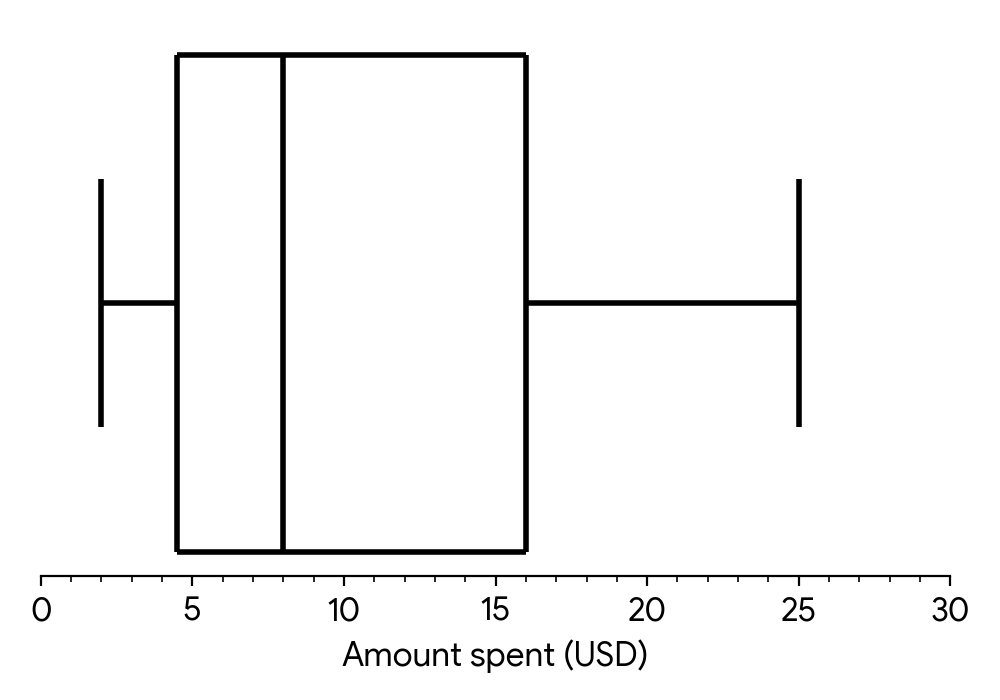
(g) Estimate the number of customers who spent between $4.50 and $16.
(h) The top 25% of customers spent more than USD. Find the value of .
The following week, a new promotion is introduced, which is expected to attract an additional 3 customers per hour.
(i) Calculate the new mean number of customers per hour.
(j) State, with a reason, the effect this increase would have on the range of the number of customers per hour.
The total frequency is given in the question. The sum of the frequencies in the table must equal this total.
The modal class is the class interval with the highest frequency.
The median is the value corresponding to 50% of the total frequency. Find this value on the cumulative frequency axis and read the corresponding value on the horizontal axis.
First, find the cumulative frequency for 35 customers from the graph. This tells you how many hours had 35 or fewer customers. Then, use the total number of hours to find how many hours had more than 35 customers.
Consider whether this group of customers is representative of all customers who visit the coffee shop at different times and on different days.
Systematic sampling involves selecting items at regular intervals from an ordered list. How could you apply this to customers entering a shop?
Identify what $4.50 and $16 represent on the box and whisker diagram. What percentage of the data lies between these two values?
The 'top 25%' corresponds to a specific feature of the box and whisker plot. Which one is it?
First, calculate the original mean number of customers per hour. Then, consider how adding 3 to each hourly count affects this mean.
The range is the difference between the maximum and minimum values. If every data point increases by 3, what happens to the maximum value? What happens to the minimum value? What happens to their difference?
Question 6
EasyPaper 1 · no calculator3 marksIn an IB Mathematics class, students are split into two tutorial groups. The morning group has 15 students and their mean score on a recent test was 78. The afternoon group has 10 students and their mean score was 93.
Find the mean score for the entire class.
To find the overall mean, you need the total score of all students and the total number of students. Remember that the mean is calculated as (sum of all values) / (number of values).
Question 7
MediumPaper 2 · calculator7 marksThe following table shows the advertising spending (in thousands of dollars) and the corresponding monthly sales (in thousands of units) for a new product over several months.
| Advertising Spending (x) | Monthly Sales (y) |
|---|---|
| 5 | 13 |
| 8 | 15 |
| 10 | 17 |
| 12 | 19 |
| 15 | 21 |
| 18 | 23 |
| 20 | 24 |
| 22 | 25 |
The data is also represented on the following scatter diagram.
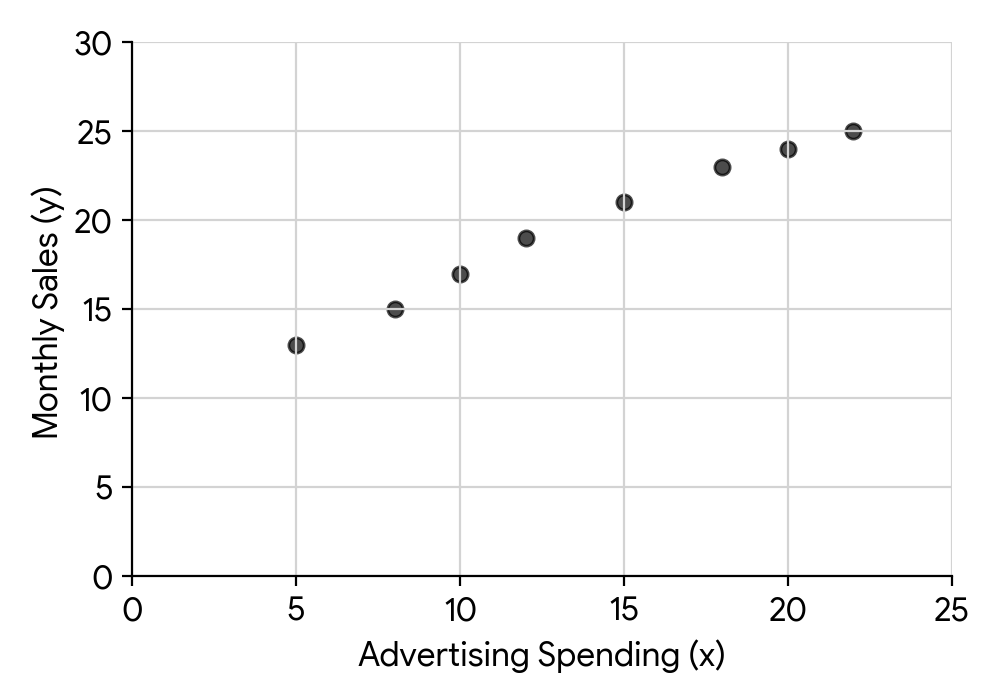
The relationship between advertising spending (x) and monthly sales (y) can be modelled by the regression line of y on x with equation , where .
Write down the value of and the value of .
Use this model to predict the monthly sales (in thousands of units) when the advertising spending is 25 thousand dollars.
Write down the value of and the value of .
Draw the line of best fit on the scatter diagram.
Use your GDC to find the linear regression equation . Input the x-values and y-values into your calculator's statistics function.
Substitute the given value of x into the regression equation you found in part (a).
Use your GDC to find the mean of the x-values and the mean of the y-values from the given data.
Remember that the line of best fit must pass through the mean point and have the correct slope (determined by 'a').
Question 8
EasyPaper 1 · no calculator6 marksThe box plot below shows the time, in minutes, taken by a group of students to complete a crossword puzzle.
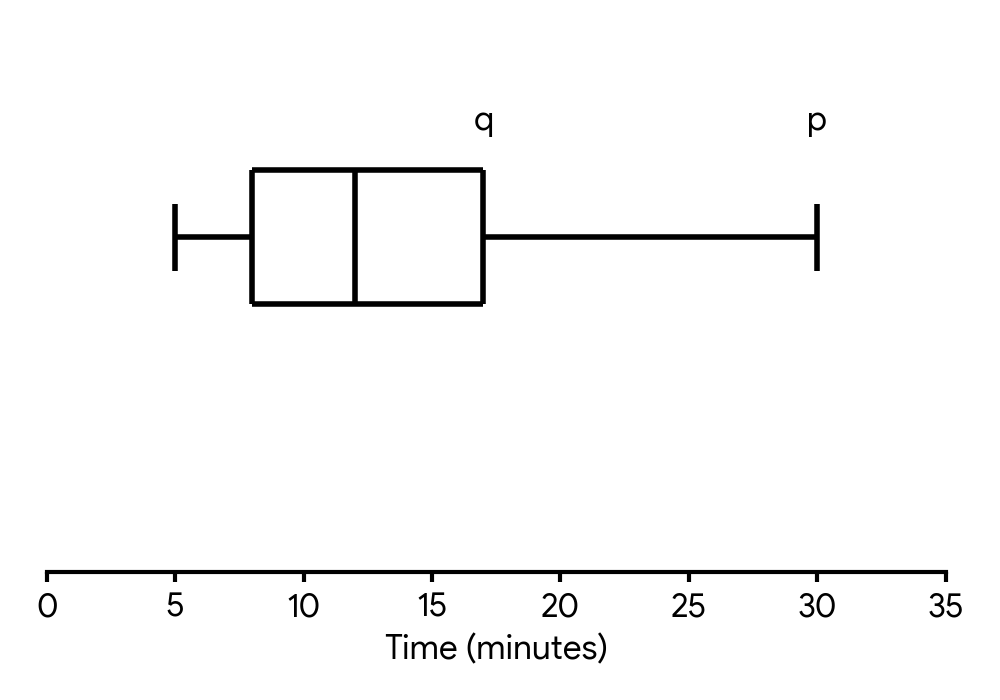
(a) Write down the median time.
(b) Write down the minimum time.
(c) The range of the times is minutes. Find the value of .
(d) The interquartile range is minutes. Find the value of .
The median is represented by the line inside the box of the box plot. Read the value from the axis that corresponds to this line.
The minimum value is represented by the end of the leftmost 'whisker' of the box plot. Read the value from the axis that corresponds to this point.
Recall the definition of the range of a data set. It is the difference between the maximum and minimum values. Set up an equation using the given range and the minimum value you found in part (b).
Recall the definition of the interquartile range (IQR). It is the difference between the upper quartile () and the lower quartile (). You can read the value of from the box plot.
Question 9
MediumPaper 2 · calculator7 marksA botanist is studying the growth of a particular plant species. They record the average height of several plants (in cm) at different weeks after planting. The data collected is shown in the table below.
| Week (x) | Height (y) (cm) |
|---|---|
| 2 | 8.4 |
| 4 | 10.9 |
| 6 | 14.5 |
| 8 | 18.2 |
| 10 | 19.8 |
| 12 | 22.8 |
The relationship between the week number (x) and the plant height (y) can be modelled by the regression line of y on x with equation , where .
Write down the value of and the value of .
Use this model to predict the height of a plant after 15 weeks.
Write down the mean week number, , and the mean plant height, .
Draw the line of best fit on a scatter diagram for this data.
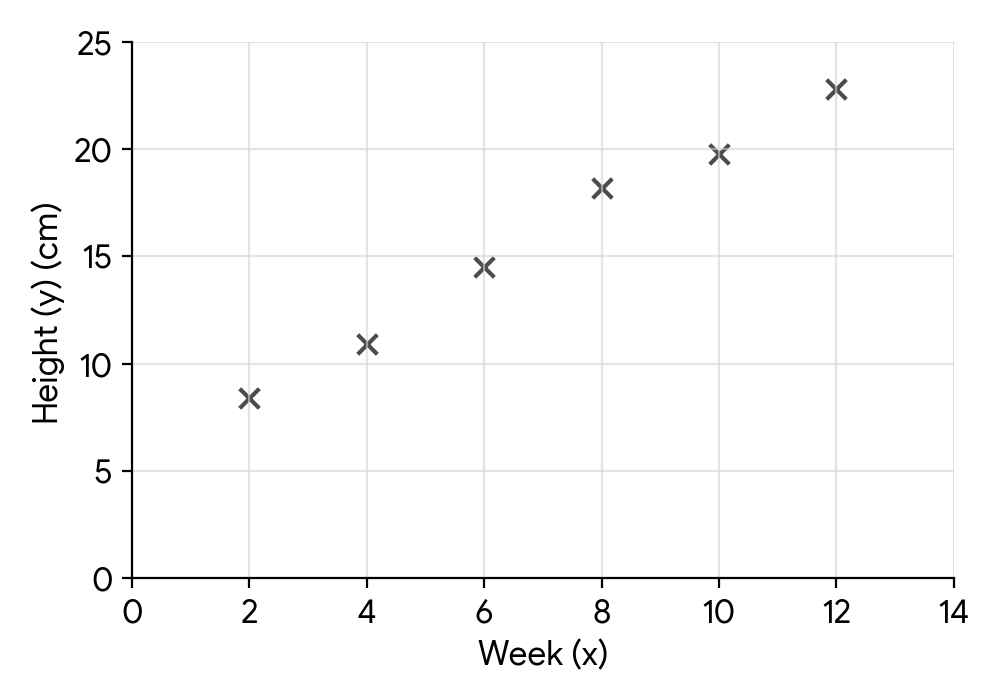
Use your GDC to perform linear regression on the given data. Input the week numbers into one list and the corresponding heights into another. The calculator will provide the values for 'a' (slope) and 'b' (y-intercept) for the regression line . Remember to round to an appropriate number of significant figures, usually three.
Substitute the given week number (x = 15) into the regression equation that you found in part (a). Make sure to use the unrounded values for 'a' and 'b' from your GDC for the most accurate result before rounding the final answer.
Your GDC can calculate the mean of the x-values and the mean of the y-values when you perform linear regression or use basic statistical functions. Look for and in the statistical output.
The line of best fit must pass through the mean point that you found in part (c). Use the slope 'a' and y-intercept 'b' from part (a) to accurately draw the line. Plot at least two points (e.g., the y-intercept and the mean point) and connect them with a straight line using a ruler.
Question 10
EasyPaper 1 · no calculator3 marksThe mean monthly salary of the employees at a company is 450. In December, every employee receives a Christmas bonus of $200. Find the new mean and standard deviation of the employees' income for December.
Consider how adding a constant value to every data point in a set affects the measure of central tendency (the mean) and the measure of spread (the standard deviation).
Question 11
MediumPaper 2 · calculator4 marksThe daily commute time to work (in minutes) for a group of employees is shown in the following table.
| Commute time (minutes) | Number of employees |
|---|---|
| 10 | 4 |
| 15 | x |
| 20 | 7 |
| 25 | 5 |
| 30 | 3 |
The median commute time is 17.5 minutes.
Find the value of x.
| Commute time (minutes) | Number of employees |
|---|---|
| 10 | 4 |
| 15 | x |
| 20 | 7 |
| 25 | 5 |
| 30 | 3 |
Using the value of x found in part (a), find the standard deviation of the commute times.
The median of 17.5 minutes indicates that the two middle values in the ordered data set are 15 and 20. Consider the total frequency and the cumulative frequencies up to these values.
Use your GDC's statistics functions for grouped data, or apply the formula for standard deviation. Remember to use the value of x you found in part (a).
Question 12
MediumPaper 2 · calculator4 marksA survey was conducted among a group of students to determine the number of video games they played per week. The results are shown in the following frequency table.
| Number of games played per week | Frequency |
|---|---|
| 1 | 5 |
| 2 | 3 |
| 3 | x |
| 4 | 6 |
| 5 | 4 |
| 6 | 2 |
The median number of games played is 3.5.
(a) Find the value of x.
(b) Find the standard deviation of the number of games played per week.
The median of 3.5 implies that the two middle values, when arranged in order, are 3 and 4. Consider the total frequency and where these middle values fall in the cumulative frequency.
Use the value of x found in part (a) to complete the frequency table. Then, use a GDC to calculate the standard deviation for the given data.
Question 13
MediumPaper 2 · calculator6 marksA botanist conducted an experiment to compare the growth of a particular plant species under two different lighting conditions: natural sunlight and artificial grow lights. A random sample of 10 plants was grown under each condition for a month, and their increase in height (in cm) was recorded.
The box and whisker diagrams for the height increase are shown below.
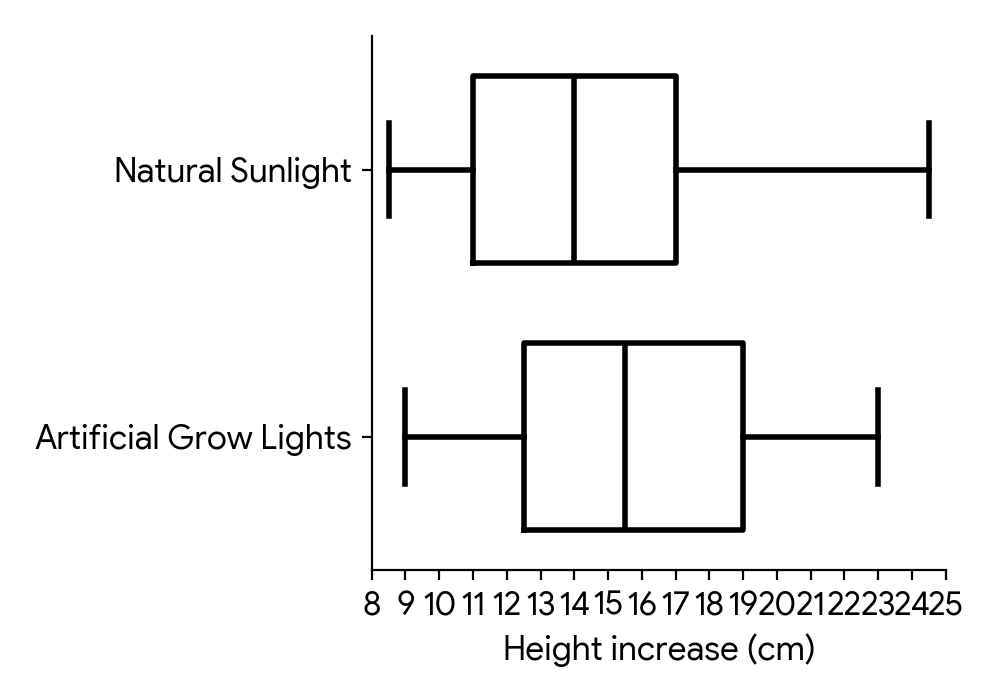
Consider the box and whisker diagram representing the height increase for plants grown in natural sunlight.
(a) State the median height increase for plants grown in natural sunlight.
(b) Verify that the measurement of 24.5 cm is not an outlier for plants grown in natural sunlight.
(c) For plants grown in natural sunlight, state why it appears that the mean height increase is greater than the median height increase.
(d) Now consider the two box and whisker diagrams. Comment on whether these box and whisker diagrams provide any evidence that might suggest that artificial grow lights cause an increase in plant height.
The median is represented by the line inside the box of the box and whisker diagram.
Recall the formula for identifying outliers: values outside or are considered outliers. Calculate the Interquartile Range (IQR) first.
Consider the symmetry of the distribution. Where is the median located within the box, and how do the lengths of the whiskers compare?
Compare the key features (median, quartiles, spread) of the two distributions. Is one distribution generally shifted higher than the other?
Question 14
MediumPaper 2 · calculator8 marksA customer service center recorded the number of calls received per hour over several days. The data is presented in the following cumulative frequency table.
| Number of calls (x) | Frequency (f) | Cumulative Frequency (cf) |
|---|---|---|
| 0 | 5 | 5 |
| 1 | 12 | 17 |
| 2 | 18 | m |
| 3 | 10 | n |
| 4 | 5 | 50 |
Find the values of and .
Write down the value of the mean number of calls received per hour.
Find the variance of the number of calls received per hour.
Recall that the cumulative frequency for a given class is the sum of its frequency and the frequencies of all preceding classes.
Use the one-variable statistics function on your GDC with the given data and frequencies.
Use the one-variable statistics function on your GDC. Ensure you select the correct variance (population variance, usually denoted by or similar).
Question 15
MediumPaper 2 · calculator4 marksA survey was conducted among teenagers to determine the number of video games they own. The results are presented in the frequency table below.
| Number of video games (x) | Frequency (f) |
|---|---|
| 1 | 8 |
| 2 | 12 |
| 3 | k |
| 4 | 6 |
| 5 | 4 |
Given that the mean number of video games owned is , calculate the value of .
Recall the formula for the mean of a frequency distribution. Set up an equation using the given mean and solve for the unknown frequency.
Question 16
MediumPaper 1 · no calculator7 marksA student records the number of hours they study for an exam over a period of 6 consecutive days. The data is shown below:
where and are integers representing the hours on the last two days, and .
The mode of the data is 15 hours. The median of the data is 14 hours.
(a) Find the value of and the value of .
(b) Find the mean number of hours the student studied over the 6 days.
Start by using the definition of the mode. This will tell you the value of one of the unknown variables. Then, use the definition of the median for a list with an even number of items to set up an equation to find the other variable. Remember to order the data first, and you might need to consider different cases for where the unknown value lies.
The mean is the sum of all the data points divided by the number of data points. Use the values of x and y you found in part (a).
Question 17
MediumPaper 1 · no calculator8 marksState the mathematical condition used to identify outliers in a set of data.
A botanist measures the heights, in cm, of 11 seedlings. The results, ordered from smallest to largest, are shown below.
Find the median, the lower quartile, the upper quartile, and the interquartile range for these heights.
Using the condition from part (a), identify, with a reason, any outliers for this set of data.
The condition involves the interquartile range (IQR). How far away from the quartiles can a data point be before it's considered an outlier?
The data is already ordered. Identify the middle value for the median. Then find the median of the lower and upper halves of the data for the quartiles. The interquartile range is the difference between the upper and lower quartiles.
Use your values for Q1, Q3, and IQR from part (b) to calculate the upper and lower boundaries for outliers. Then check if any data points fall outside these boundaries.
Question 18
MediumPaper 2 · calculator6 marks(a) A small artisanal bakery recorded its daily revenue for days, finding a mean revenue of USD. On the th day, a special promotion was run, and the mean revenue for all days increased to USD. Find the revenue generated on the th day.
(b) For the days, the lower quartile () of the daily revenue was USD and the upper quartile () was USD. Determine, with justification, whether the revenue on the th day (found in part (a) ) is considered an outlier.
Recall that the mean is calculated by dividing the sum of all values by the number of values. You can use this to find the total revenue before and after the th day.
An outlier is typically defined as a value that falls outside the range , where .
Question 19
MediumPaper 2 · calculator14 marksA group of students participated in a puzzle-solving competition. The time, minutes, taken by each student to complete the puzzle was recorded and grouped into the following frequency table.
| Time (minutes) | Frequency |
|---|---|
| 8 | |
| 15 | |
| 22 | |
| 18 | |
| 10 | |
| 7 |
State the total number of students who participated in the competition.
Find the midpoint of the modal class.
Estimate the mean time taken to complete the puzzle.
Estimate the standard deviation of the times.
A quick calculation suggests the median is minutes. Find a more precise estimate for the median time by considering its position within the interval it belongs to. Give your answer to the nearest integer.
To find the total number of students, sum all the frequencies in the table.
The modal class is the interval with the highest frequency. The midpoint of an interval is the average of its lower and upper bounds.
To estimate the mean for grouped data, use the formula , where represents the midpoint of each class interval.
The formula for the estimated standard deviation for grouped data is . You can use the midpoints and the mean calculated in part (c.i).
The median position is . Use linear interpolation: , where is the lower boundary of the median class, is the total frequency, is the cumulative frequency before the median class, is the frequency of the median class, and is the class width.
Question 20
MediumPaper 2 · calculator19 marks(a) Data on the number of goals scored by a football team in each of their matches during a season is represented in the table below.
| Number of goals () | Frequency () |
|---|---|
State whether this data is discrete or continuous.
(b) Find the mode.
(c) (i) Find the mean.
(c) (ii) Find the standard deviation.
(d) (i) Find the median.
(d) (ii) Find the lower quartile ().
(d) (iii) Find the upper quartile ().
(e) Hence draw a box-and-whisker plot for this data using a scale of cm for goal.
(f) Identify with justification any outliers.
Consider the nature of 'number of goals'. Can it take any value within a range, or only specific, distinct values?
The mode is the value that appears most frequently in the data set.
Use the formula for the mean of a frequency distribution: . You can also use your GDC's statistics function.
Use the formula for standard deviation of a frequency distribution, or use your GDC's statistics function. Remember to use the population standard deviation () for grouped data unless otherwise specified.
For data points, the median is the value at the position. For discrete data, if this position is , it's the average of the -th and -th values. Alternatively, use your GDC.
For data points, the lower quartile () is the value at the position. For discrete data, if this position is or , round up to the next integer position. Alternatively, use your GDC.
For data points, the upper quartile () is the value at the position. For discrete data, if this position is or , round up to the next integer position. Alternatively, use your GDC.
You need the five-number summary: minimum, , median, , maximum. Plot these points on a scaled axis and draw the box and whiskers accordingly. Remember the scale: cm for goal.
An outlier is typically defined as a data point that falls below or above . Calculate the Interquartile Range (IQR) first.
No question on this page matches those filters. Try another difficulty or paper.
18 more Measures of central tendency & measures of dispersion (std. Dev, var, IQR) questions in the app
Every answer is marked mark by mark, IB-style, and the AI tutor helps when you are stuck.
Where marks are lost
- Using your own wrong value after failing a "show that".
