Probability basics (expected #, complementary events, probability of event): notes and practice questions
- Probability of an event (P(E)):
- Complementary events: .
- Expected value (E(X)) for a random variable:
- Probabilities are between 0 and 1, where and .
How it is examined
Note the IB's notation: the sample space is and the complement is . An expected number is allowed to be non-integer (12.8 students), and rounding it is wrong. 2 to 4 marks.
and are given.
- Concepts of trial, outcome, equally likely outcomes, relative frequency, sample space () and event.
- The probability of an event is .
- The complementary events and (not ).
- Expected number of occurrences.
Linking questions
- Aim 8: the ethics of gambling.
- Links to other subjects: theoretical genetics and Punnett squares (biology).
Practice questions
37 questions · 7 easy · 21 medium · 9 hardQuestion 1
EasyPaper 1 · no calculator4 marksLet C be the event that a randomly chosen household in a town has a cat, and D be the event that the household has a dog. It is known that , and .
(a) Find the probability that a randomly chosen household has a cat or a dog.
(b) Find the probability that a randomly chosen household has neither a cat nor a dog.
Recall the addition rule for probability for two events: .
The event 'neither a cat nor a dog' is the complement of the event 'a cat or a dog'. This can be represented as . Consider using De Morgan's laws.
Question 2
MediumPaper 2 · calculator6 marksEvents S and C are independent. The probability that a student passes a Statistics exam, P(S), is twice the probability that the student passes a Calculus exam, P(C).
Given that the probability a student passes at least one of these exams is 0.625, find the probability that the student passes the Calculus exam, P(C).
Recall the formula for the probability of the union of two events, , and the specific condition for independent events. Remember that probability values must be between 0 and 1.
Question 3
HardPaper 1 · no calculator16 marksA spinner with four sectors is spun. The sectors are numbered 1, 2, 3, and 4. Let be the score obtained when the spinner is spun. The probability distribution for is given in the following table.
| 1 | 2 | 3 | 4 | |
|---|---|---|---|---|
| **P()** | 0.1 | 0.3 |
(a) Find the value of .
(b) Find the value of .
A second spinner, B, is also spun. Let be the score obtained. The probability distribution for is given in the following table.
| 1 | 2 | 3 | 4 | |
|---|---|---|---|---|
| **P()** |
(c) (i) State the range of possible values of .
(ii) Hence, find the range of possible values of .
(d) Hence, find the range of possible values for .
Leo spins spinner A once and Mia spins spinner B once. The probability that Leo's score is greater than Mia's score is .
(e) Find the value of .
What is the sum of all probabilities in a probability distribution?
Recall the formula for the expected value of a discrete random variable, .
What is the fundamental range for any probability value?
Use the relationship between m and n from the fact that all probabilities sum to 1, combined with your answer from (c.i).
Express E(Y) in terms of a single variable (either m or n) and then use the range you found in part (c) to find the minimum and maximum possible values for E(Y).
First, list all the possible outcomes where Leo's score (X) is greater than Mia's score (Y). Then, write an expression for the total probability of this event in terms of m and n. Set this expression equal to the given probability and solve for m. Finally, use this value to calculate E(Y).
Question 4
EasyPaper 1 · no calculator4 marksIn a survey of a group of high school students, it was found that the probability that a student participates in the school's music program is 0.5, and the probability that a student plays on a school sports team is 0.6. The probability that a student participates in both is 0.2.
Let M be the event that a student participates in the music program and S be the event that a student plays on a sports team.
(a) Find the probability that a randomly selected student participates in the music program or plays on a sports team.
(b) Hence, find the probability that a randomly selected student participates in neither the music program nor a sports team.
Recall the addition rule for probability: . You are looking for .
The event 'neither M nor S' is the complement of the event 'M or S'. Use your answer from part (a).
Question 5
MediumPaper 1 · no calculator6 marksOn a Saturday at a cinema, a sample of 50 customers was randomly selected. They were asked how many snack items they had purchased. This information is summarized in the following frequency table.
| Number of snacks purchased () | 0 | 1 | 2 | 3 | 4 |
|---|---|---|---|---|---|
| Frequency () | 8 | 15 | 20 | 5 | 2 |
It can be assumed that this sample is representative of all customers for the following day.
For the following day, Sunday, estimate
(i) the probability that a randomly selected customer will purchase at least one snack item.
For the following day, Sunday, estimate
(ii) the expected number of snacks purchased by a customer.
It is known that 800 customers will attend the cinema on Sunday. The average price of a snack item is $5.50.
Estimate the total revenue from snack sales on Sunday.
To find the probability of purchasing at least one snack, you can either sum the frequencies for 1, 2, 3, and 4 snacks and divide by the total number of customers, or you can find the probability of purchasing zero snacks and subtract this from 1.
The expected value is calculated by summing the product of each outcome and its probability. For a frequency table, this is .
First, use your answer from part (a.ii) to estimate the total number of snacks that will be sold to the 800 customers. Then, use the average price per snack to calculate the total revenue.
Question 6
HardPaper 2 · calculator16 marks(a) The random variable follows a normal distribution with mean and standard deviation .
Find .
(b) The diameters of ball bearings produced by a factory, in mm, are normally distributed with mean and standard deviation . The ball bearings are categorized as defective, standard, large, or premium, according to their diameter. The following table shows the probability a ball bearing is classified into each category.
| Category | Probability |
|---|---|
| Defective | 0.03 |
| Standard | 0.65 |
| Large | 0.25 |
| Premium | 0.07 |
The maximum diameter of a defective ball bearing is 14.8 mm.
The minimum diameter of a premium ball bearing is 16.5 mm.
Find the value of and of .
(c) The factory rejects all defective ball bearings. The remaining ball bearings are sold.
Find the probability that a ball bearing chosen at random from those sold is categorized as
(i) standard;
(ii) large;
(iii) premium.
(d) The selling prices of the different categories of ball bearings at this factory are shown in the following table:
| Category | Selling Price ($) |
|---|---|
| Standard | 1.50 |
| Large | 1.80 |
| Premium | 2.50 |
The factory incurs a fixed cost of $300 for the production run and assumes it will sell the accepted ball bearings in exactly the same proportion as calculated in part (c).
According to this model, find the minimum number of accepted ball bearings that must be sold so that the net profit for the factory is at least $550.
Recall that for a normal distribution, you can standardize the variable to a standard normal variable using the formula . Then use your GDC to find the probability.
Use the given probabilities and boundary values to find the corresponding z-scores. Then, set up two simultaneous equations involving and and solve them.
This is a conditional probability problem. The new sample space consists only of non-defective ball bearings.
Remember to use the new sample space (non-defective ball bearings) for this conditional probability.
The denominator for the conditional probability remains the probability of a non-defective ball bearing.
First, calculate the expected revenue per accepted ball bearing using the probabilities from part (c) and the selling prices. Then, set up an inequality for the total profit.
Question 7
EasyPaper 1 · no calculator4 marksIn a survey, a group of students were asked if they play football (F) or basketball (B). The probability that a student plays football is 0.6, and the probability that a student plays basketball is 0.7. The probability that a student plays at least one of these sports is 0.9.
(a) Find the probability that a student plays both football and basketball.
(b) Find the probability that a student plays neither football nor basketball.
Recall the addition rule for probabilities: . You are given three of these values and need to find the fourth.
The event 'plays neither sport' is the complement of the event 'plays at least one sport'. How do you calculate the probability of a complementary event?
Question 8
MediumPaper 1 · no calculator15 marksA tech company is testing the battery life of its new smartphone. A sample of 120 phones are tested to see how long their batteries last under continuous video playback. The results are shown in the cumulative frequency graph below.
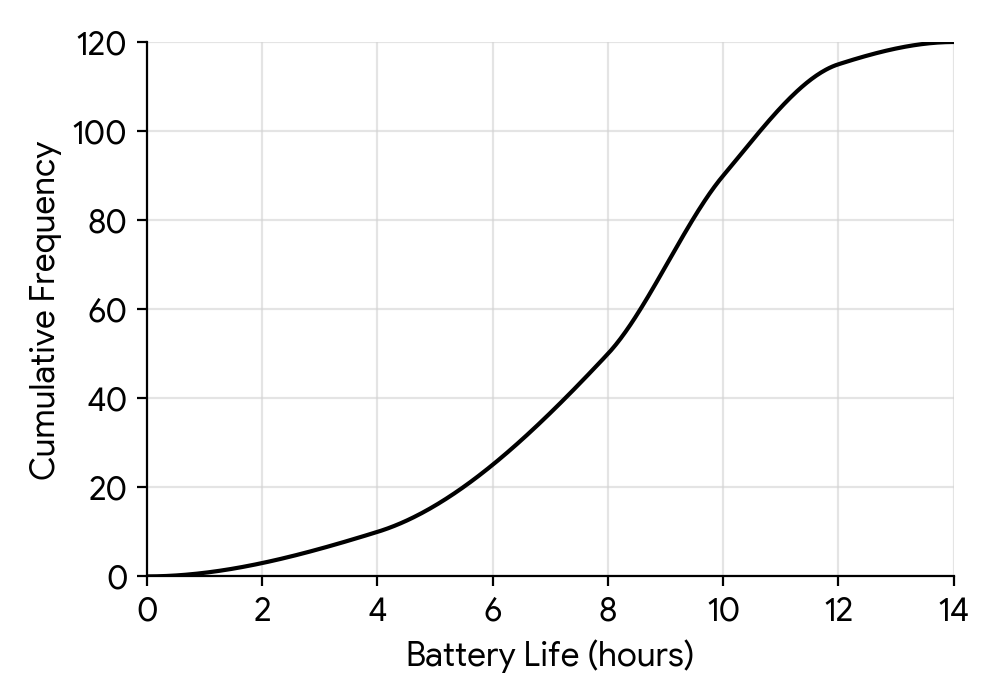
(a) Find the median battery life.
(b) The lowest 25% of battery lives in the sample are less than hours. Find the value of .
(c) The same data is represented by the following frequency table.
| Battery Life (h) | ||||
|---|---|---|---|---|
| Frequency | 10 | 5 |
Find the value of and the value of .
(d) The company manufactures a batch of 10,000 of these smartphones. Estimate the number of phones in the batch that will have a battery life of more than 10 hours.
(e) The company wishes to advertise the 'typical' battery life of the phone based on this test.
(i) Explain why this testing method might not provide an accurate representation of the battery life for a typical user.
(ii) Suggest a more appropriate method for testing the battery life to represent a typical user.
The median is the value for the middle data point. In a cumulative frequency graph with N data points, this corresponds to the value on the x-axis for a cumulative frequency of N/2.
This question is asking for the lower quartile (Q1). First, calculate the cumulative frequency corresponding to the 25th percentile, and then find the corresponding value on the x-axis from the graph.
The cumulative frequency is the running total of the frequencies. To find the frequency for a specific interval, you need to subtract the cumulative frequency at the start of the interval from the cumulative frequency at the end of the interval.
First, use the graph to find the number of phones in the sample with a battery life of more than 10 hours. Then, use this proportion to estimate the number for the entire batch of 10,000 phones.
Think about how you use your own phone. Is it always for continuous video playback? What other activities affect battery life?
How could the company make the test more realistic?
Question 9
HardPaper 2 · calculator18 marksIn a large university, 200 students were surveyed. Of those, 120 were undergraduates (U) and the rest postgraduates (P).
Each student in the survey was asked whether they preferred quiet zones (Q) or collaborative areas (C) for studying. It was found that 75 of the undergraduates preferred quiet zones. The total number of students who preferred collaborative areas was 100. This information is shown in the following table.
| Quiet Zones (Q) | Collaborative Areas (C) | Total | |
|---|---|---|---|
| Undergraduates (U) | 75 | p | 120 |
| Postgraduates (P) | x | 55 | 80 |
| Total | q | 100 | 200 |
Find the value of
;
.
Three students are chosen at random from those surveyed. Find the probability that all three are postgraduates.
Given that , find the value of .
A student is chosen at random from those surveyed. Write down the probability that they are a postgraduate who prefers quiet zones.
Determine if the events P (Postgraduate) and Q (prefers Quiet Zones) are independent. Justify your answer.
It can be assumed that the survey results are representative of the university population. Ten students from the university are chosen at random. Find the probability that at least five of them prefer quiet zones.
Use the row total for undergraduates and the number of undergraduates preferring quiet zones to find .
Use the grand total and the total number of students preferring collaborative areas to find .
Remember that once a student is chosen, they are not replaced. This affects the total number of students and postgraduates for subsequent selections.
Recall the formula for conditional probability: . In this case, .
This is a direct probability from the completed table. Look for the cell representing postgraduates who prefer quiet zones and divide by the total number of students.
Two events A and B are independent if or if . Calculate these probabilities using your table values.
This scenario involves a fixed number of trials (10 students) and a probability of success (preferring quiet zones) for each trial. Consider which probability distribution is appropriate.
Question 10
EasyPaper 1 · no calculator8 marksA card is drawn at random from a standard deck of 52 playing cards.
(a) Find the probability that the card is a Queen.
(b) Find the probability that the card is a spade.
(c) Find the probability that the card is a red card.
(d) Find the probability that the card is an even numbered card (2, 4, 6, 8, 10).
How many cards are in a standard deck? How many of them are Queens? The probability of an event is the number of favourable outcomes divided by the total number of possible outcomes.
A standard deck is divided into four suits: hearts, diamonds, clubs, and spades. How many cards are in each suit?
The four suits are hearts, diamonds, clubs, and spades. Two of these suits are red and two are black. How many cards are in the red suits altogether?
First, count how many different even numbers can appear on a card. Then, remember that each number appears in all four suits. Calculate the total number of even numbered cards.
Question 11
MediumPaper 1 · no calculator5 marksTwo archers, Clara and David, are competing. To decide who shoots an arrow, a fair six-sided die is rolled. If the die shows a 1, Clara is chosen. If the die shows any other number, David is chosen.
The probability that Clara hits the target is . The probability that David hits the target is .
(a) Find the probability that the target is hit.
(b) Let be the event that Clara is chosen and let be the event that the target is hit. Determine, with a reason, whether events and are independent.
First, determine the probability of choosing each archer based on the die roll. Then, use a tree diagram or the law of total probability to find the overall probability of hitting the target.
To check for independence between two events A and B, you can verify if or if .
Question 12
HardPaper 2 · calculator17 marks(a) A batch of electronic components contains defective components and functional components. Components are selected randomly, one by one, without replacement.
(i) Find, in terms of , the probability that the first component selected is defective.
(ii) Given that , , and , find the probability that the first two components selected are defective.
(b) Show that the probability that the first two components selected are functional is 0.35.
(c) Find the probability that the first three components selected are all functional.
(d) Find the probability that at least one of the first three components selected is defective.
(e) A technician earns 10 points if the first defective component is found on the third test, and 50 points if the first defective component is found on the fourth test. The technician tests such batches. Find the least value of such that the technician's expected total score is greater than 100.
The probability of an event is the number of favorable outcomes divided by the total number of possible outcomes.
Consider the probability of the first event, then the probability of the second event given the first, and multiply them.
Similar to part (a.ii), but for functional components. Simplify the fraction to show the decimal.
Extend the logic from part (b) for three consecutive functional components.
Consider the complementary event: what is the opposite of 'at least one defective'?
First, calculate the probability of finding the first defective component on the third test. Then, calculate the probability of finding the first defective component on the fourth test. Use these probabilities to find the expected points per batch, and then set up an inequality for the total expected score.
Question 13
EasyPaper 1 · no calculator8 marksA fair spinner with 8 equal sectors, numbered 1 to 8, is spun once.
(a) Find the probability that the spinner lands on the number 7.
(b) Find the probability that the spinner lands on a multiple of 3.
(c) Find the probability that the spinner lands on a perfect square.
(d) Find the probability that the spinner lands on a number that is a factor of 8.
(e) Find the probability that the spinner lands on a number greater than 8.
Probability is calculated as the number of favourable outcomes divided by the total number of possible outcomes. How many sectors are there in total, and how many of them are labelled '7'?
First, identify all the numbers from 1 to 8 that are multiples of 3. Then, use the probability formula.
A perfect square is a number that is the square of an integer. List the perfect squares between 1 and 8.
List all the numbers that divide 8 without leaving a remainder. These are the factors of 8. Then calculate the probability.
Consider the possible outcomes when the spinner is spun. Is it possible for it to land on a number greater than 8?
Question 14
MediumPaper 1 · no calculator7 marksA local coffee shop, "The Daily Grind", surveyed a random sample of 50 customers about their purchasing habits over one week. The following table shows the number of coffees purchased by these customers.
| Number of coffees purchased | Frequency |
|---|---|
| 0 | 5 |
| 1 | 12 |
| 2 | 18 |
| 3 | 10 |
| 4 | 5 |
This sample is considered representative of all customers for the following week.
For the following week, estimate:
(a.i) the probability that a randomly selected customer will purchase at least one coffee;
(a.ii) the expected number of coffees a customer will purchase.
(b) The coffee shop expects to serve 800 customers in the following week. Each large batch of coffee brewed can serve a maximum of 20 cups.
Estimate the minimum number of large batches of coffee that must be brewed to meet the expected demand.
The probability of purchasing at least one coffee is 1 minus the probability of purchasing zero coffees. Alternatively, sum the frequencies for customers who bought 1, 2, 3, or 4 coffees and divide by the total number of customers surveyed.
The expected value is the sum of each outcome multiplied by its probability. Remember to use the total number of customers surveyed to find the probabilities for each outcome.
First, calculate the total number of coffees expected to be sold in the week for all 800 customers. Then, use the capacity of each batch to determine how many batches are needed. Remember that you cannot brew a fraction of a batch.
Question 15
HardPaper 2 · calculator16 marksThe lifespan, (in hours), of a certain type of LED light bulb is modelled by a normal distribution with mean and standard deviation .
It is known that and .
Find the probability that a randomly selected light bulb has a lifespan between hours and hours.
Find the value of and the value of .
A manufacturer tests a batch of randomly selected light bulbs. Any bulb with a lifespan greater than hours is considered a 'long-life' bulb. Lifespans of bulbs are independent of each other.
Find the probability that exactly bulbs in the batch are 'long-life' bulbs.
Given that fewer than bulbs are 'long-life' bulbs, find the probability that exactly bulbs are 'long-life' bulbs.
In another factory, a different type of LED light bulb is produced. The lifespan of these bulbs, (in hours), is normally distributed with a mean of hours. The interquartile range (IQR) for these bulbs is hours.
Find the value of the standard deviation, , for this type of bulb.
Recall that the sum of probabilities for all possible outcomes in a continuous distribution is 1. Consider the regions defined by the given probabilities.
Use the inverse normal function to find the z-scores corresponding to the given probabilities. Then set up a system of two linear equations using the formula and solve for and .
This scenario involves a fixed number of trials (bulbs), two possible outcomes ('long-life' or not), and independent trials. This suggests a binomial distribution.
This is a conditional probability problem. Remember the formula . Here, event A is 'exactly 25 bulbs are long-life' and event B is 'fewer than 30 bulbs are long-life'.
The interquartile range is the difference between the upper quartile () and the lower quartile (). For a normal distribution, corresponds to the 25th percentile and to the 75th percentile. Use the inverse normal function to find the z-scores for these percentiles.
Question 16
EasyPaper 1 · no calculator6 marksA machine in a factory produces light bulbs. On average, 1 out of every 8 light bulbs is defective.
(a) The machine produces 400 light bulbs in a day. Calculate the expected number of defective light bulbs produced in one day.
(b) In a week, the machine produces 2800 light bulbs. Calculate the expected number of non-defective light bulbs produced in that week.
(c) The factory needs to ship an order of 1400 non-defective light bulbs. Calculate the total number of light bulbs the machine would be expected to produce to meet this order.
The expected number of an event is found by multiplying the total number of trials by the probability of the event occurring in a single trial.
First, determine the probability that a light bulb is not defective. Then, apply the formula for expected value. Alternatively, find the expected number of defective bulbs and subtract this from the total.
Let 'N' be the total number of light bulbs produced. Set up an equation where N multiplied by the probability of a bulb being non-defective equals 1400.
Question 17
MediumPaper 1 · no calculator6 marksConsider events and such that , and .
(a) Find .
(b) Determine if events and are independent. Justify your answer.
First, find the probability of event C occurring using the given probability of its complement, C'. Then, use the formula for conditional probability, , to find the probability of the intersection.
To determine if two events are independent, you need to check if or if . You will first need to find using the formula for the union of two events: .
Question 18
HardPaper 2 · calculator16 marks(a) The resistance, R ohms, of resistors produced by a factory is normally distributed with a mean of 100 ohms and a standard deviation of 3.5 ohms.
Find the probability that a randomly selected resistor has a resistance less than 98 ohms.
(b) In a random sample of 15 resistors, find the probability that exactly 4 of them have a resistance less than 98 ohms.
(c.i) The capacitance, C microfarads, of capacitors produced by the same factory is normally distributed with a mean of 50 F and a standard deviation of 2.8 F. Each day, 70% of the components produced are resistors and 30% are capacitors.
Find the probability that a randomly selected component has a value less than its respective threshold (i.e., less than 98 ohms for a resistor or less than 47 F for a capacitor).
(c.ii) Given that a randomly selected component has a value less than its respective threshold, find the probability that it is a resistor.
(d) The resistor manufacturing process is adjusted so that the mean resistance remains 100 ohms but its standard deviation changes to ohms. The capacitor manufacturing process is not adjusted. The probability that a randomly selected component from these machines has a value less than its respective threshold is now 0.160.
Find the value of .
Use the normal cumulative distribution function (CDF) on your GDC. Remember to input the lower bound, upper bound, mean, and standard deviation.
This is a binomial probability problem. Identify the number of trials (n), the number of successes (k), and the probability of success (p) from part (a).
First, find the probability that a capacitor has a capacitance less than 47 F. Then, use the law of total probability, considering the proportion of resistors and capacitors produced.
This is a conditional probability problem. Use Bayes' theorem: P(A|B) = P(A and B) / P(B).
Work backwards. Use the new total probability and the unchanged capacitor probability to find the new probability for resistors. Then use the inverse normal function to find the z-score, and finally calculate the new standard deviation.
Question 19
EasyPaper 1 · no calculator4 marksA letter is chosen at random from the word 'CONSTITUTION'. Find the probability that it is a vowel or a letter that appears more than once.
First, count the total number of letters in the word. This will be the denominator of your probability. Then, identify the letters that are either vowels or appear more than once. Be careful not to double-count any letters when finding the total number of favourable outcomes. The formula for the union of two events, , might be helpful.
Question 20
MediumPaper 2 · calculator6 marks(a) A beverage company fills bottles with juice. The volume of juice, in millilitres (ml), can be modelled by a normal distribution with a mean of 750 ml and a standard deviation of 2.5 ml. A bottle is considered underfilled and rejected if its volume is less than 746 ml.
Find the probability that a randomly selected bottle is rejected.
(b) Estimate the number of bottles that will be rejected from a random sample of 200 bottles.
(c) Given that a bottle is not rejected, find the probability that its volume is greater than 753 ml.
Recall the properties of the normal distribution. You need to calculate the probability of the volume being less than a certain value. Use your GDC's normal cumulative distribution function (normalcdf).
Multiply the probability of rejection by the total number of bottles in the sample.
This is a conditional probability problem. Remember that 'not rejected' means the volume is 746 ml or more. You need to find .
No question on this page matches those filters. Try another difficulty or paper.
17 more Probability basics (expected #, complementary events, probability of event) questions in the app
Every answer is marked mark by mark, IB-style, and the AI tutor helps when you are stuck.
Where marks are lost
- Using your own wrong value after failing a "show that".
